 Retention of students and employees is an important measure of success. High retention rates lead to stability, increased financial health of an institution, social benefits, increased quality of life for students and public social benefits. Retention activities at Mines help ensure all Orediggers have an opportunity to remain engaged with the institution in ways that are authentic to their lived experiences and to support ongoing growth and professional development.
The federal definition of student retention (persistence rate) is measured by counting the number of students in a starting fall cohort, then counting that same cohort the following fall of the next year to see how many are still enrolled. To ensure high student retention rates, Mines employs a wide range of programs, initiatives and activities such as MEP, WISEM, Crisis Assessment, Response and Education (CARE), CASA, NeST and the Oredigger Network, part of the new Mines Mentoring Program.
Employee retention is an institution’s ability to keep talented workers and reduce turnover. Retaining quality and highly productive employees is more efficient than recruiting, training and orienting a replacement employee. The payoff for focusing on employee retention is increases in performance, productivity, employee morale and quality of work. A reduction in both turnover and employee-related problems are worth the time and financial investment. To promote employee retention, Mines created programs such as the Mines Community Alliances (MCAs), Student Life’s Pro Devo, EMPOWER, WISEM professional development opportunities and employee mentoring through the Oredigger Network.
Coming Soon…
 Work the Numbers
We will be making our data available via the Tableau platform and invite you to see what insights you can glean for yourself.

Identify Critical Transition Points and provide support though mentorship and professional development programs
Evaluate the Advising Structure for Students
and consider new models to support retention

Develop Programming
for professional development and mentorship to support career path and advancement planning for employees

Foster Initiatives
to Identify
and Develop a Diverse Leadership Team
Establish and Maintain Mines Employee Resource Groups
Sponsored by Mines’ Leadership
Key Highlights and Opportunities
Highlights:
- Mines’ undergraduate first-year fall-to-fall retention rates greatly exceed the national average, for all student populations.
- Turnover rates of Academic Faculty of color continue to be lower than turnover rates for white faculty.
- Mines is expanding key leadership roles in the DI&A space by creating the new Assistant Vice President of Student Life for Equity and Engagement.
Opportunities:
- Investigate undergraduate retention factors to reduce barriers to success for students of color after the pandemic.
- Develop supportive and inclusive strategies for reducing turnover rates for Classified Monthly employees of color.
- Understand employees’ reasons for leaving Mines by conducting exit interviews
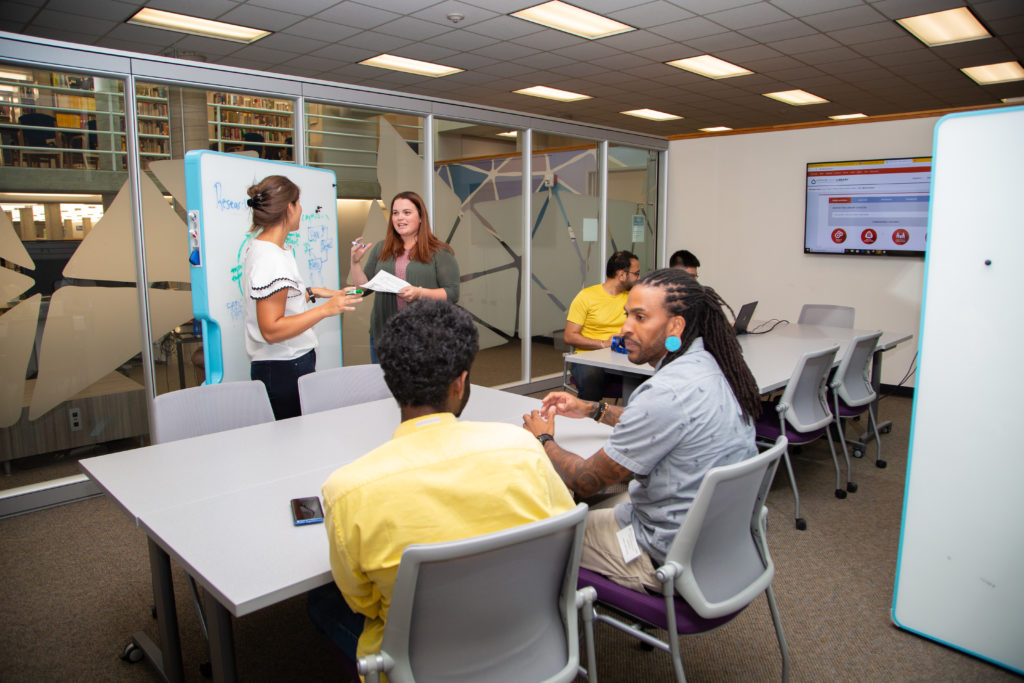
At Mines, we want everyone to have the opportunity to succeed. To ensure we provide the right kinds of support structures, resources, mentorship and professional development opportunities, we need to identify what those common transition points out of the institution are and how we can address pain-points for all Orediggers. This section will dive into retention and transition trends of students and employees at Mines. MEP staff and resources provide support mechanisms for students, including professional societies/student organizations. These professional student organizations include American Indian Science & Engineering Society (AISES), National Society of Black Engineers (NSBE), Out in Science, Technology, Engineering & Mathematics (oSTEM), Society of Asian Scientists & Engineers (SASE) and Society of Hispanic Professional Engineers (SHPE). Each society participates in community events, provides professional development opportunities, conducts bi-weekly general meetings that include connecting with industry partners and plans various social and cultural events throughout the year. MEP also supports, Kickstart, a new student organization focused on developing a cohesive and inclusive community at Mines through facilitated discussions and events surrounding topics related to diversity in the United States. Anyone is welcome to join the professional societies/student organizations.
Another program to help with retention is U-CLIMB (Undergraduate Computing Leaders Invested in Mentoring Beginners). U-CLIMB is a near-peer mentoring program in CS@Mines that trains selected students who have recently mastered CSCI 101 to mentor students currently enrolled in CSCI 101 and CSCI 102. Thanks to start-up support from the National Center for Women and Technology (NCWIT), U-CLIMB mentors foster a welcoming environment for all students to explore CS@Mines and demonstrate to students that all students in our introductory CS courses are capable of mastering the material. Computer Science recruited 14 new students to be trained during summer 2021, all of whom benefited from the U-CLIMB program during 2020-21. U-CLIMB mentors are paid hourly for their efforts, with many of them are funded by work study. An additional benefit of the U-CLIMB program from the previous year (2018-19): 92% of U-CLIMB mentors report that they feel more connected to CS@Mines because of mentoring experiences and 92% report that their 1:1 visits with mentees have contributed to their confidence in CS. For further details please visit the U-CLIMB website.
Student Withdraw Rates
Percentage of withdrawn undergraduate students compared to enrollments
| These data represent the number of racial/ethnic underrepresented undergraduate students at Mines, each fall semester, in relation to their withdraw rate. The bars in the graph indicate the number of enrolled students and the red line indicates the withdraw rate. Notice for fall 2017, fall 2018 and fall 2019, though the number of students increased, their withdraw rates remained consistent. However, a concerning trend was observed for the fall 2020 and fall 2021 classes where URG students’ withdraw rates nearly doubled in 2020 and only slightly dipped in 2021. Reasons for this observation are currently unknown. However, a project will be underway in 2022 to dive into this more deeply and make appropriate adjustments to ensure withdraw rates do not remain high for this population for future years. The data include all new and continuing undergraduate students who identify as underrepresented. Underrepresented is denoted by “URG” and include American Indian/Alaskan Native, African American/Black, Asian, Hispanic/Latinx, multiple races and Native Hawaiian/Pacific Islander populations. | 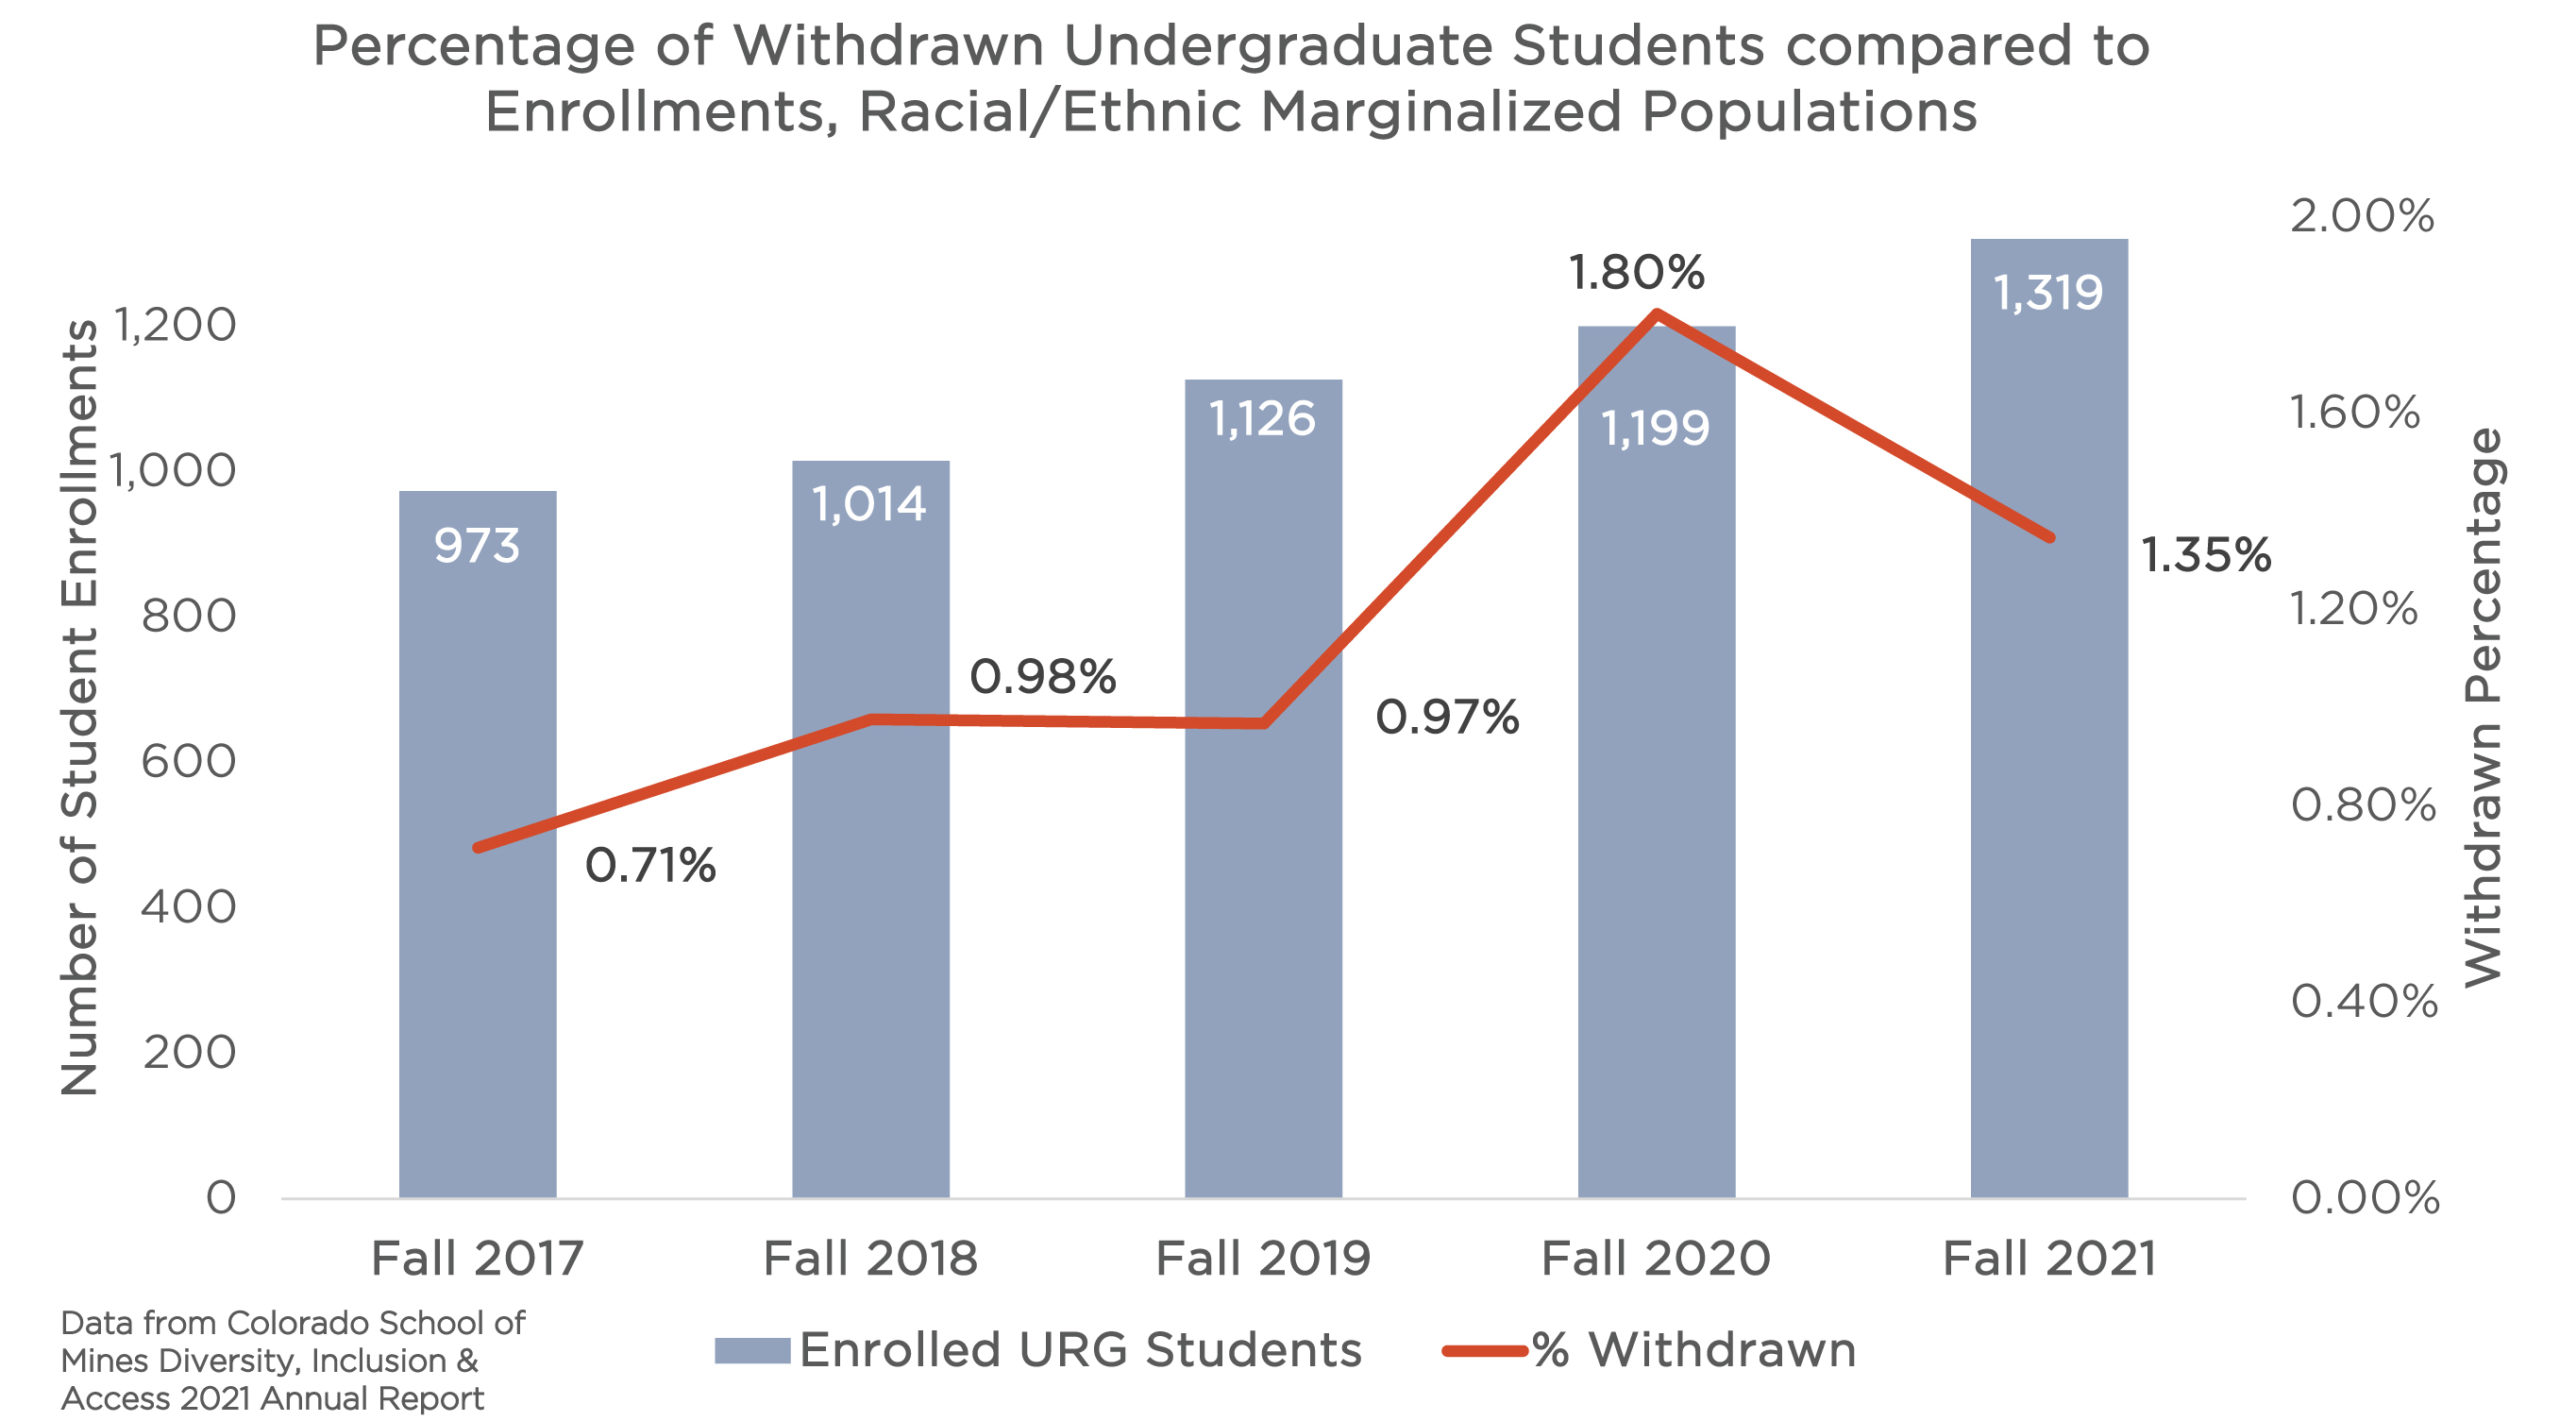 Click on graph image to view larger size Click on graph image to view larger size |
| These data represent the number of white-identifying undergraduate students at Mines, each fall semester, in relation to their withdraw rate. The bars in the graph indicate the number of enrolled students and the red line indicates the withdraw rate. There was a notable increase in withdrawn students between fall 2017 and fall 2018, however, it remained consistent until fall 2019. In stark contrast to our undergraduate students of color, white students’ withdraw rates dropped in fall 2020, perhaps demonstrating the differences in impact that 2020 had on white students versus students of color. A project will be underway in 2022 to dive into this more deeply and make appropriate adjustments to the nuances in these withdraw trends between our white and marginalized students. The data include all new and continuing undergraduate students who identify as white. This does not include international students, nor students who don’t report their race/ethnicity. | 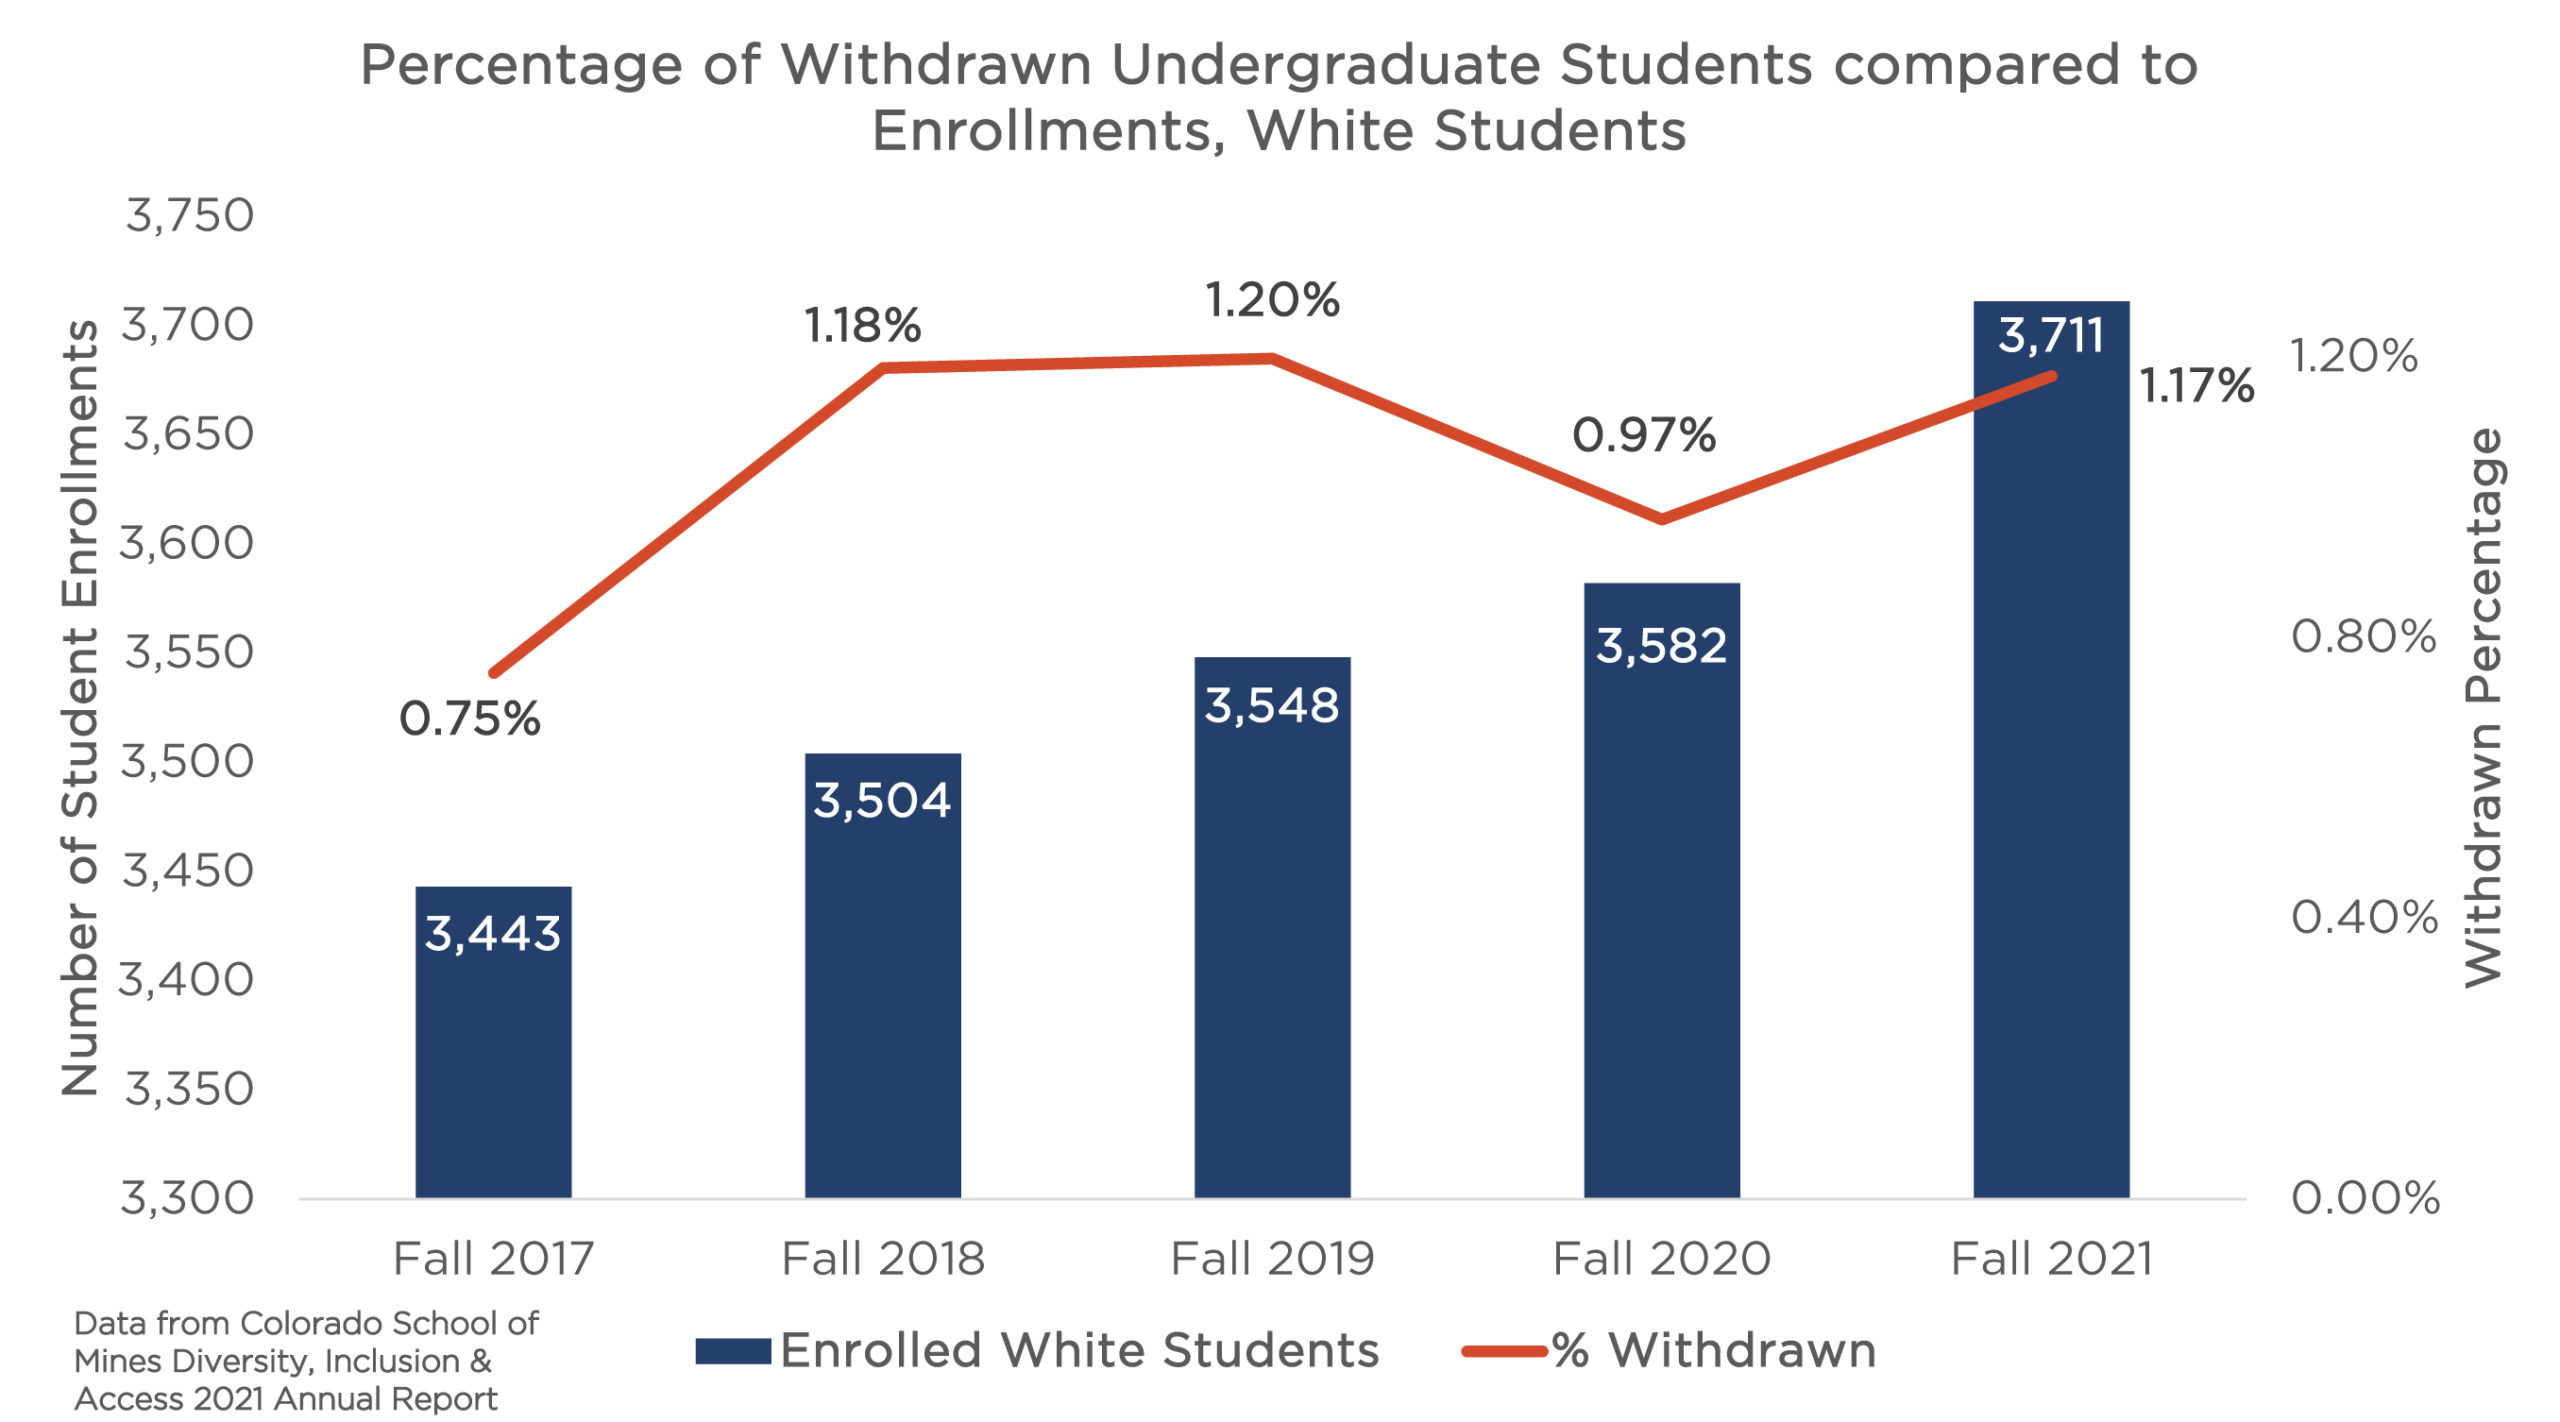 Click on graph image to view larger size Click on graph image to view larger size |
Percentage of withdrawn graduate students compared to enrollments
| These data represent the number of racial/ethnic underrepresented graduate students at Mines, each fall semester, in relation to their withdraw rate. The bars in the graph indicate the number of enrolled students and the red line indicates the withdraw rate. Because there are so few graduate students of color, the withdraw rates tend to drastically change due to one or two students leaving Mines per semester. These data include all graduate students of color under the graduate classification. Underrepresented is denoted by “URG” and include American Indian/Alaskan Native, African American/Black, Asian, Hispanic/Latinx, multiple races and Native Hawaiian/Pacific Islander populations. | 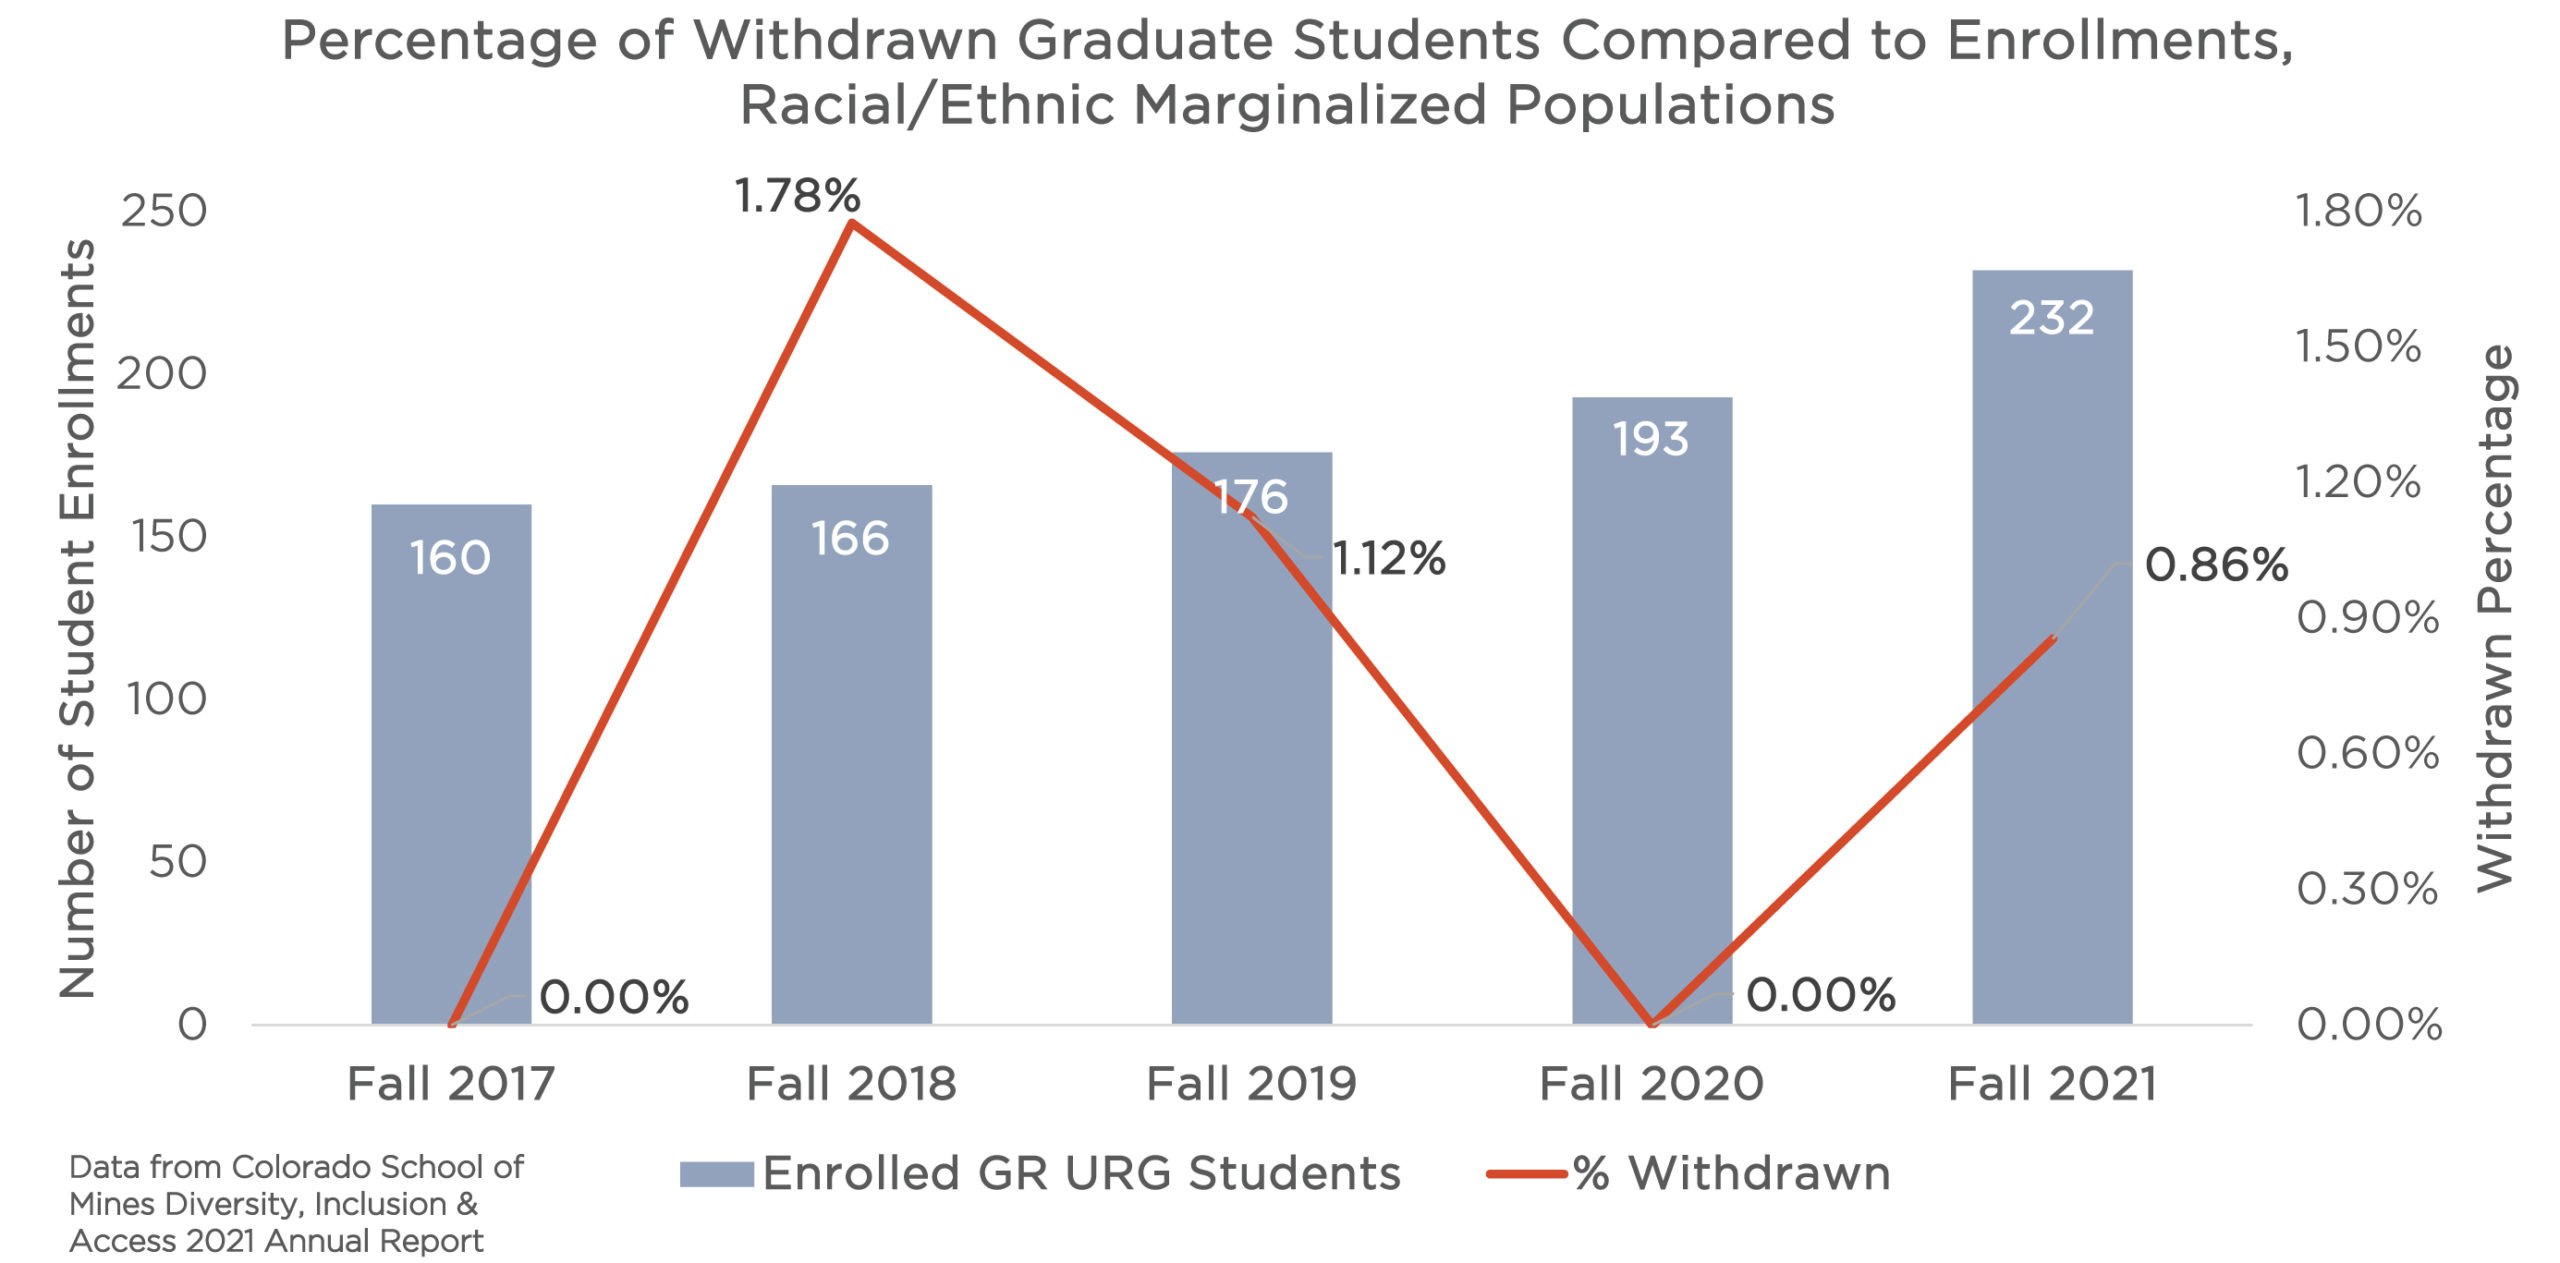 Click on graph image to view larger size Click on graph image to view larger size |
| These data represent the number of white-identifying graduate students at Mines, each fall semester, in relation to their withdraw rate. The bars in the graph indicate the number of enrolled students and the red line indicates the withdraw rate. Since fall 2018, withdraw rates have steadily increased until 2020, but leveled off in 2021. Regardless of this increase, overall rates are still lower than undergraduate withdraw rates. These data include all graduate students under the graduate classification who identify as white. This does not include international students, nor students who don’t report their race/ethnicity. | 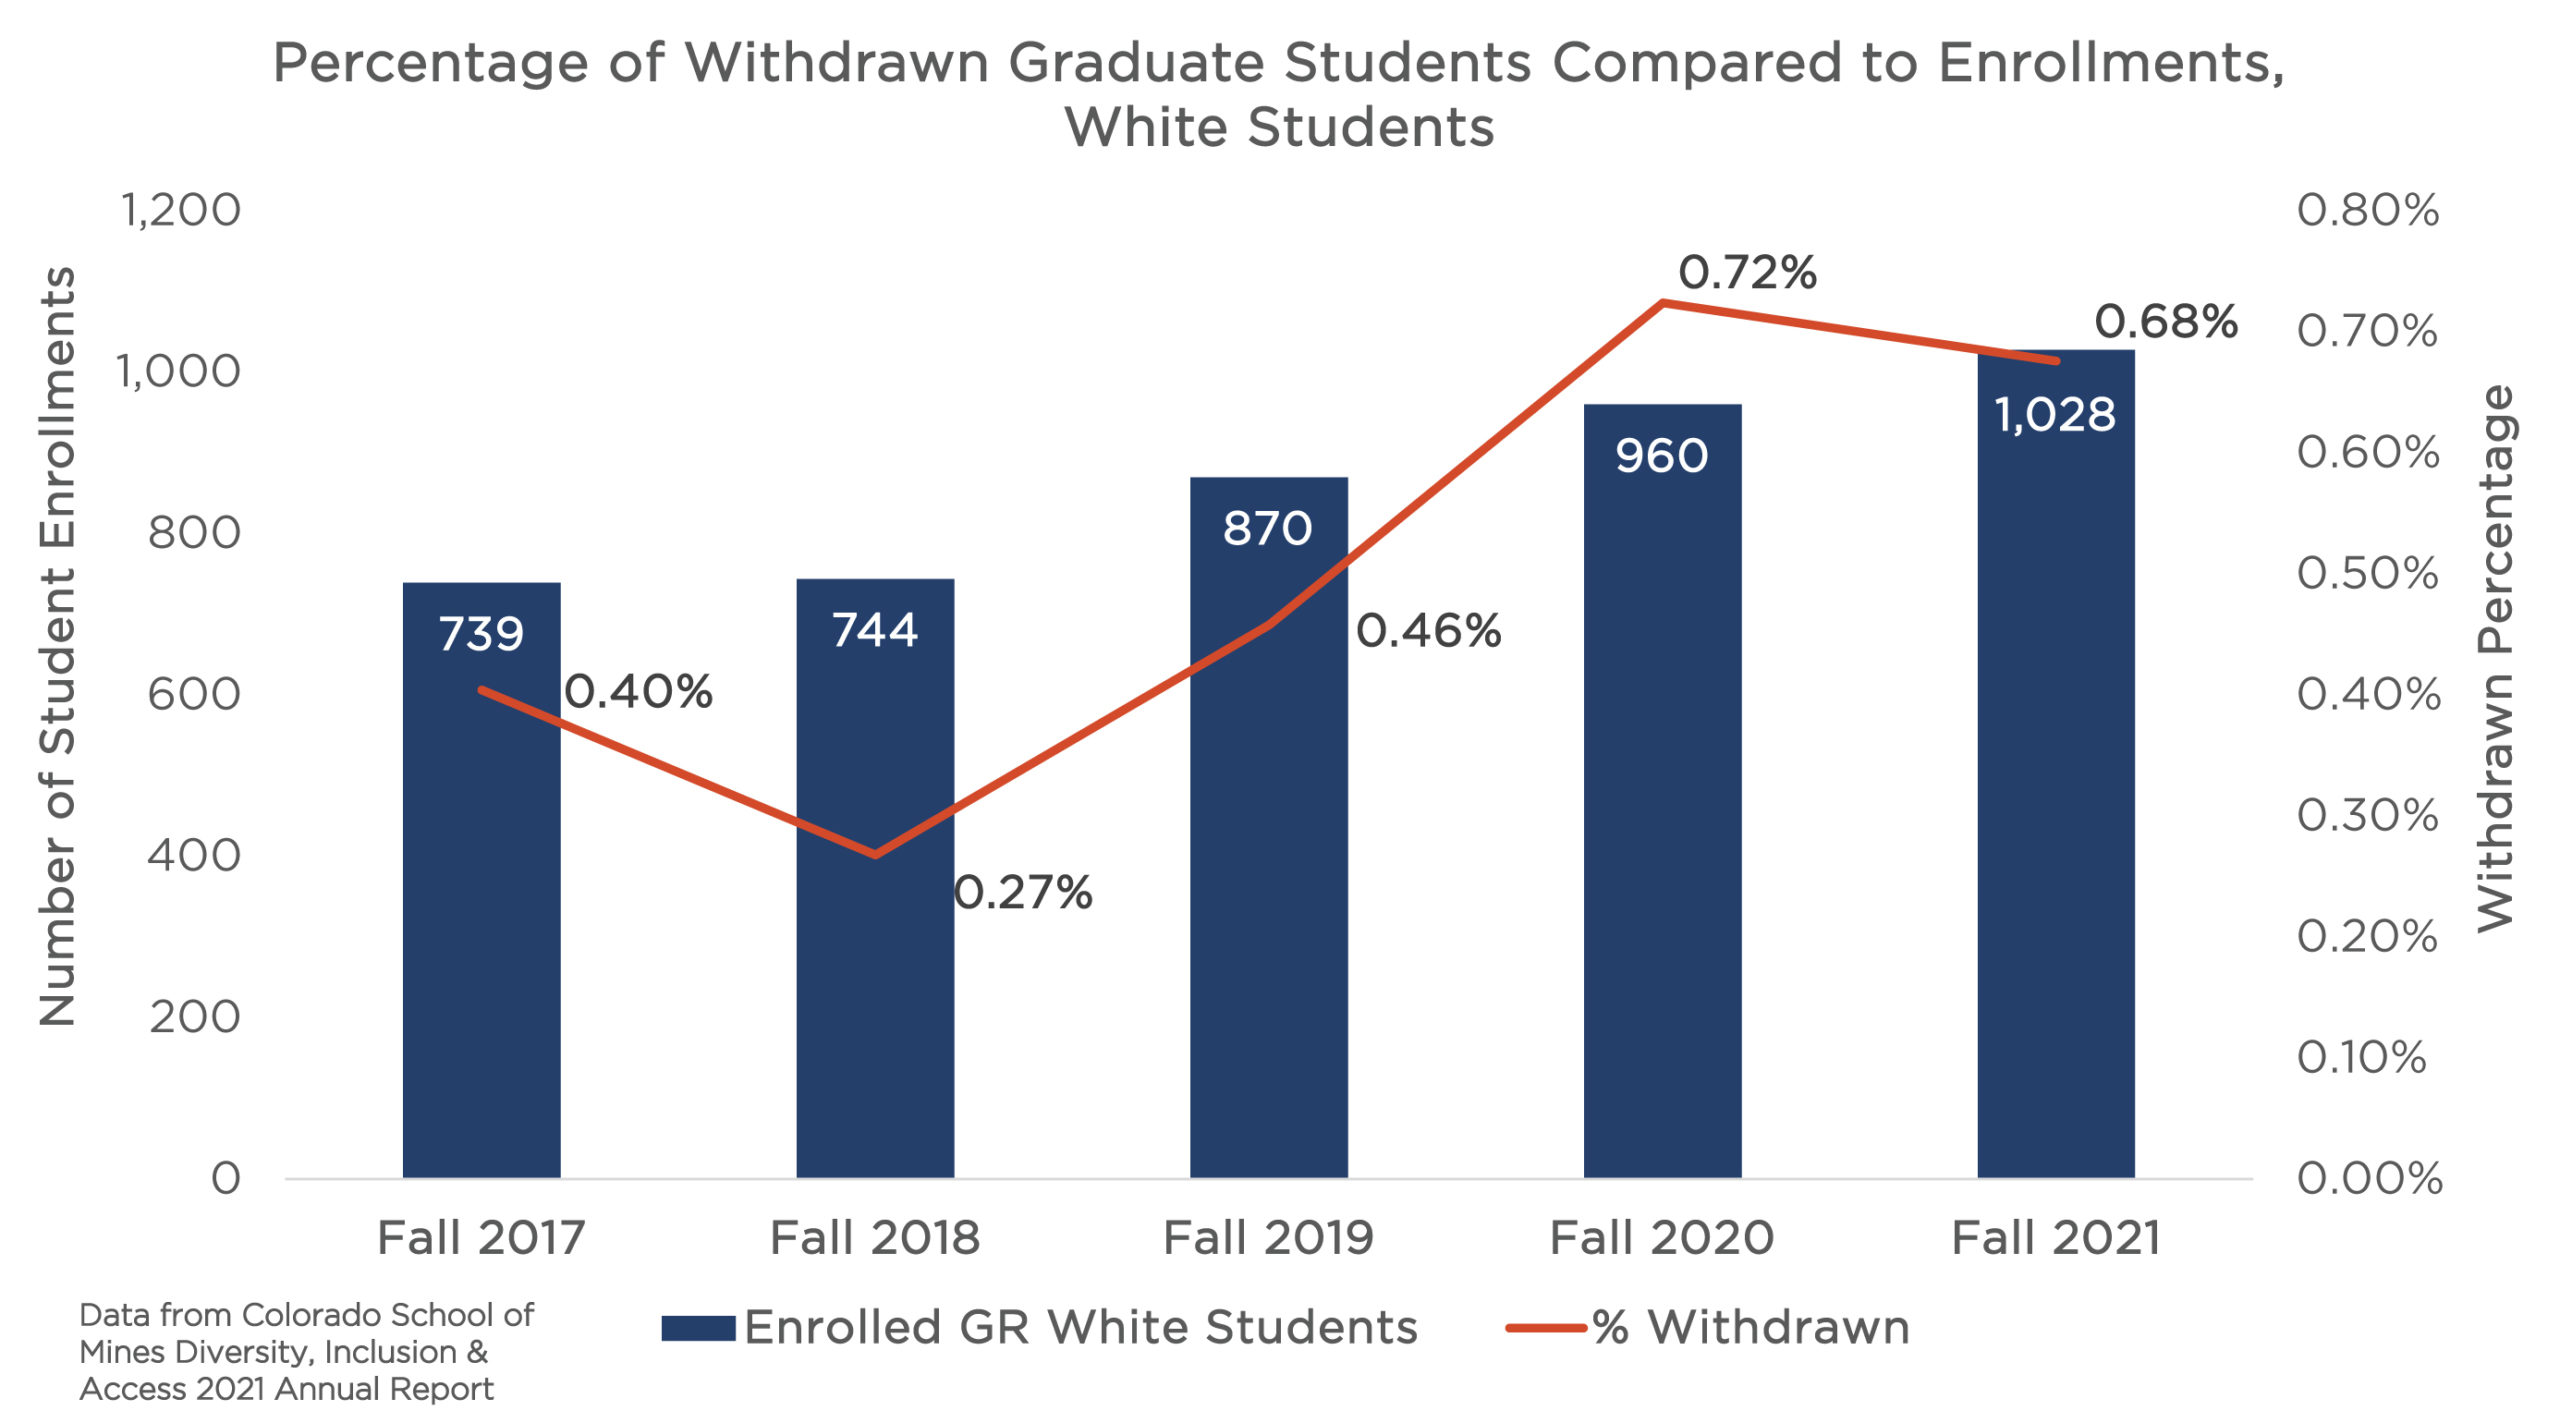 Click on graph image to view larger size Click on graph image to view larger size |
Student Retention Rates
- Undergraduate Retention Rates by Gender and Race/Ethnicity
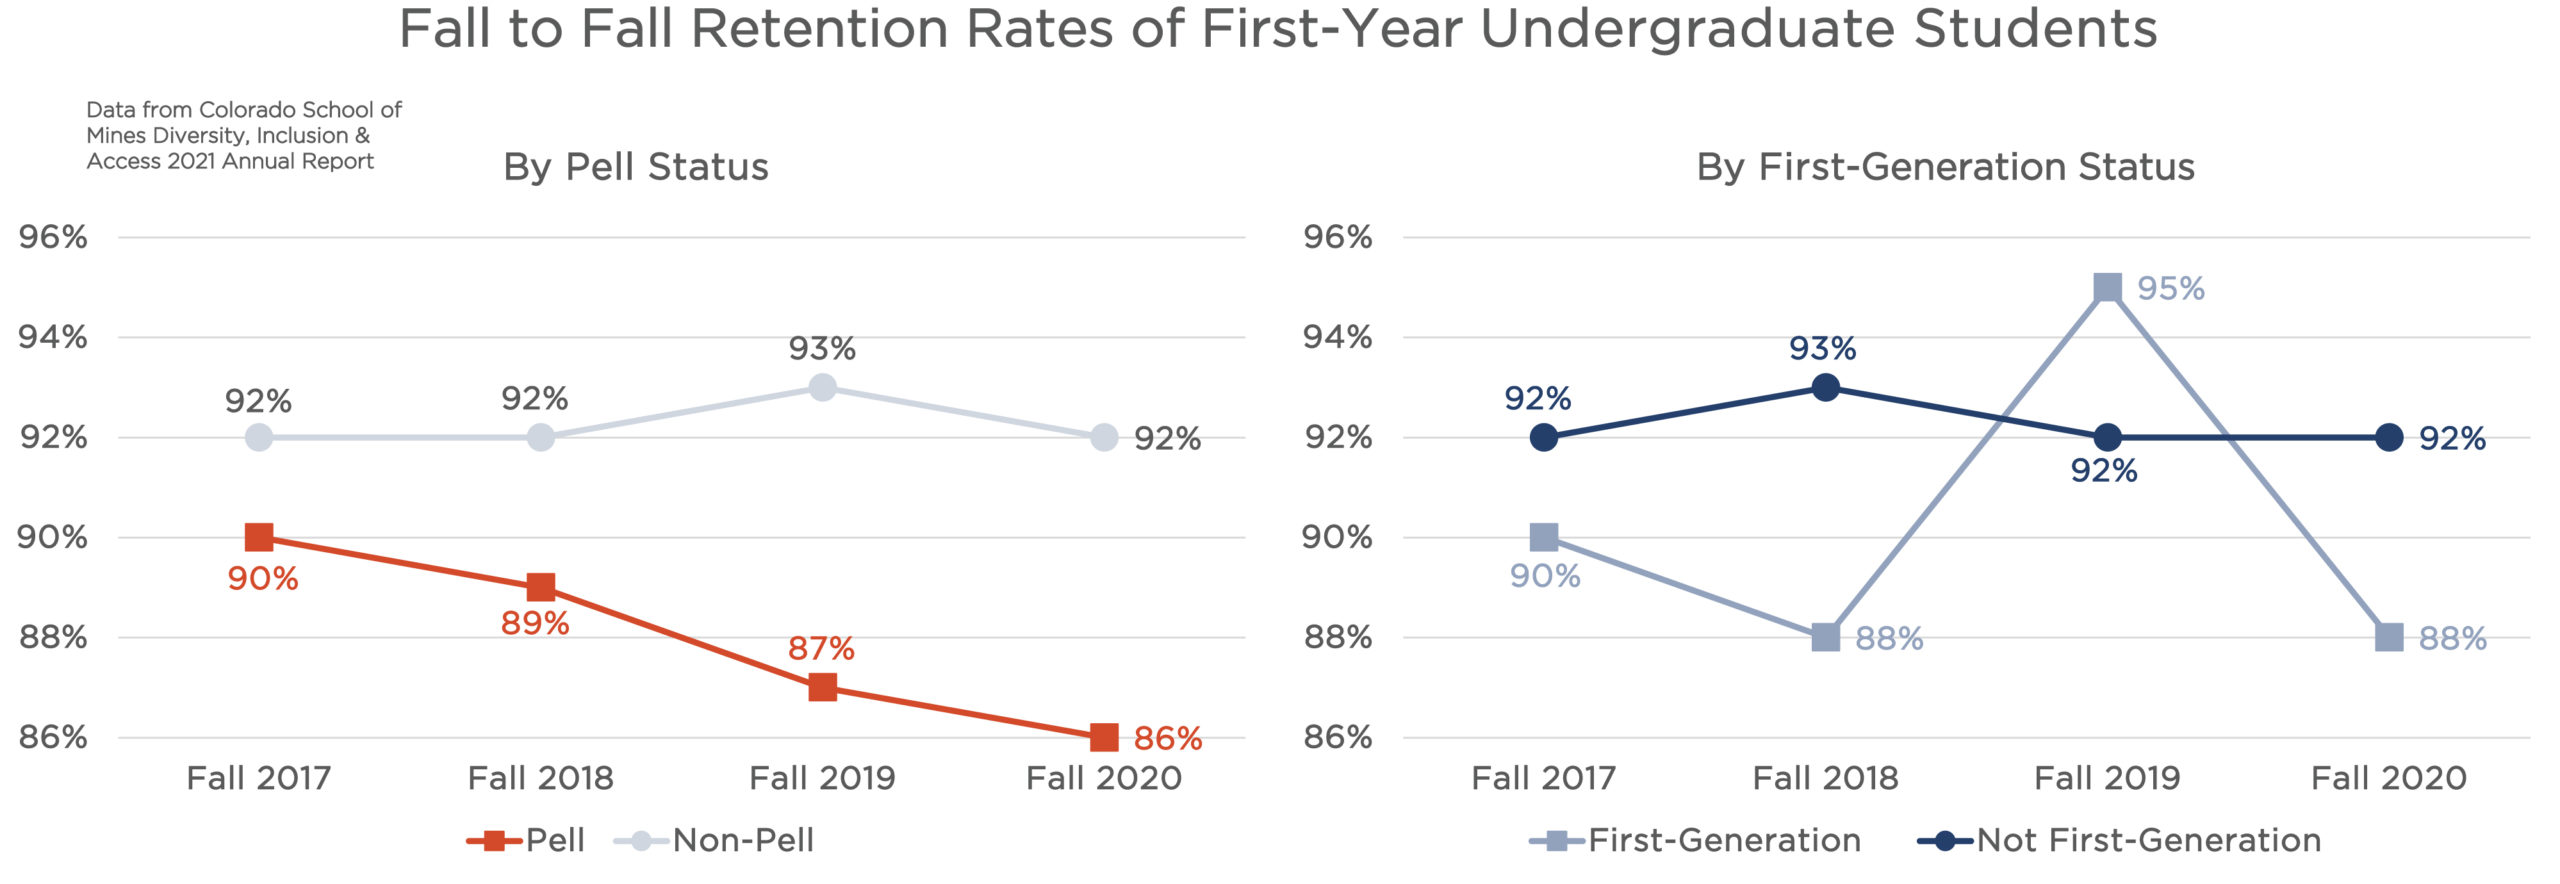
- Undergraduate Retention Rates by Pell and First-Generation Status
|
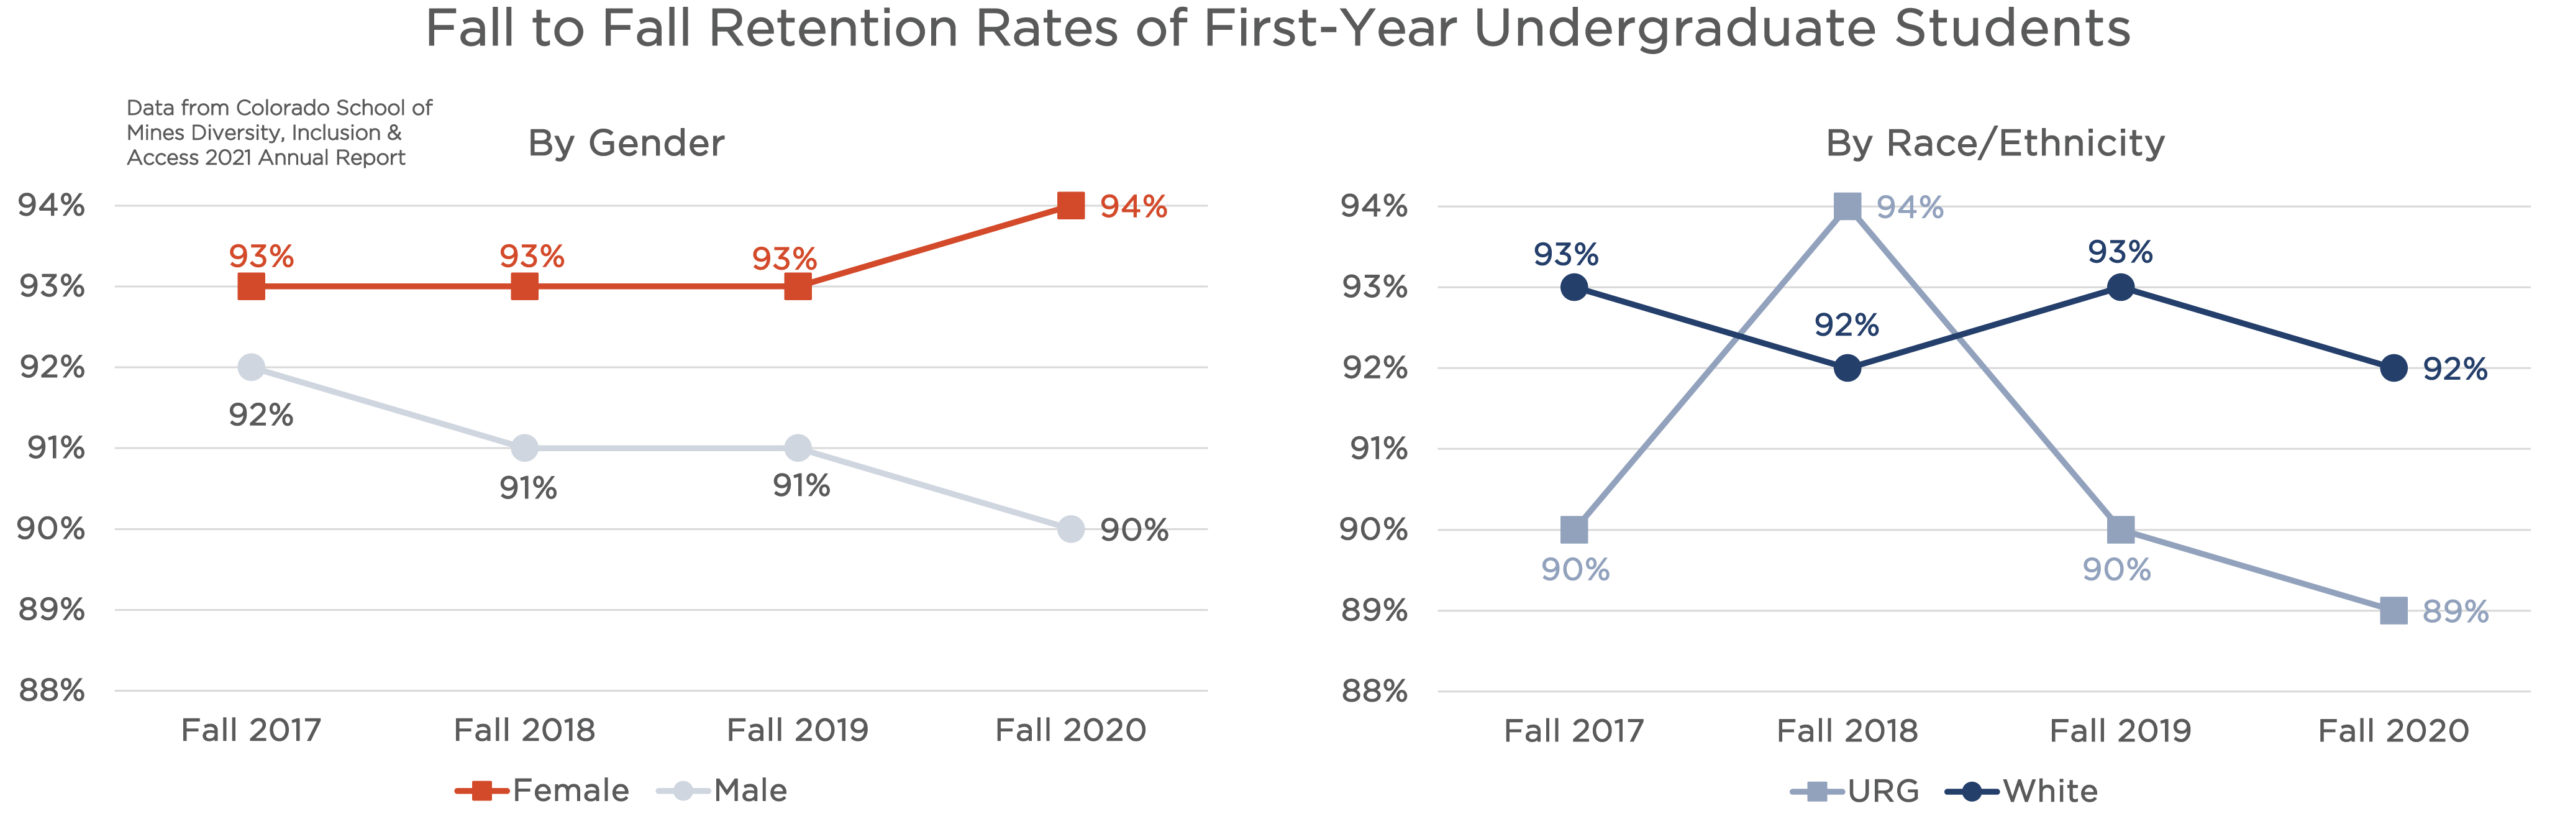
Overall, Mines has impressive fall-to-fall retention rates of our undergraduate students. These data represent the percentage of first-year students from their starting fall cohort who stay at Mines until the following fall. For example, in fall 2017, 93% of female-identifying first-year students stayed at Mines and enrolled in their sophomore year compared to 92% of male-identifying students. This graph shows the trends for all full-time, undergraduate first-year student populations by both gender (red and silver lines) and race/ethnicity (dark and light blue lines). Underrepresented is denoted by “URG” and include American Indian/Alaskan Native, African American/Black, Asian, Hispanic/Latinx, multiple races and Native Hawaiian/Pacific Islander populations. Gender is defined here as only either male or female due to limitations in data collection and reporting. |
 Click on graph image to view larger size Click on graph image to view larger size |
|
Overall, Mines has impressive fall-to-fall retention rates of our undergraduate students. These data represent the percentage of first-year students from their starting fall cohort who stay at Mines until the following fall. For example, in fall 2017, 92% of non-Pell first-year students stayed at Mines and enrolled in their sophomore year compared to 90% of Pell students. This graph shows the trends for all full-time, undergraduate first-year student populations by both Pell status (in silver and red) and first-generation status (in dark and light blue lines). Those who are Pell-eligible are students who come from lower-income families. Those who are first-generation are those who are the first in their families, other than siblings, to attend college. Notice that out of all four graphs representing fall-to-fall retention rates, the Pell-eligible students have the lowest retention rates overall. This is something Mines can consider investigating further to make sure these students have the appropriate support systems in place to ensure their success. |
 Click on graph image to view larger size Click on graph image to view larger size |
Other Retention and Transition Trends
| Each spring semester, the Trefny Innovative Instruction Center administers a climate survey to undergraduate students to understand their experiences over the past year. In 2021, over 900 students participated in the survey. One of the items that Mines is interested in learning about is students’ sources of stress so we can work together to reduce them and address potential points of attrition. The survey asked, “To what extent are each of the following factors a source of stress?” This graph illuminates the top 11 sources of stress students cited over the 2021 year from the nearly 800 students who answered these questions about stress. Students answered these questions based on a 4-point scale where 1 = “not a source of stress” and 4 = “a major source of stress.” According to the survey, students cited time management as the biggest source of stress at nearly 3 points, which equates to “a moderate source of stress” on the scale. Other sources of stress cited, but not shown in the graph included, family obligations, physical health issue, availability of faculty, separation from family, having enough food, language/communication barriers and immigration laws or regulations, in descending order. | 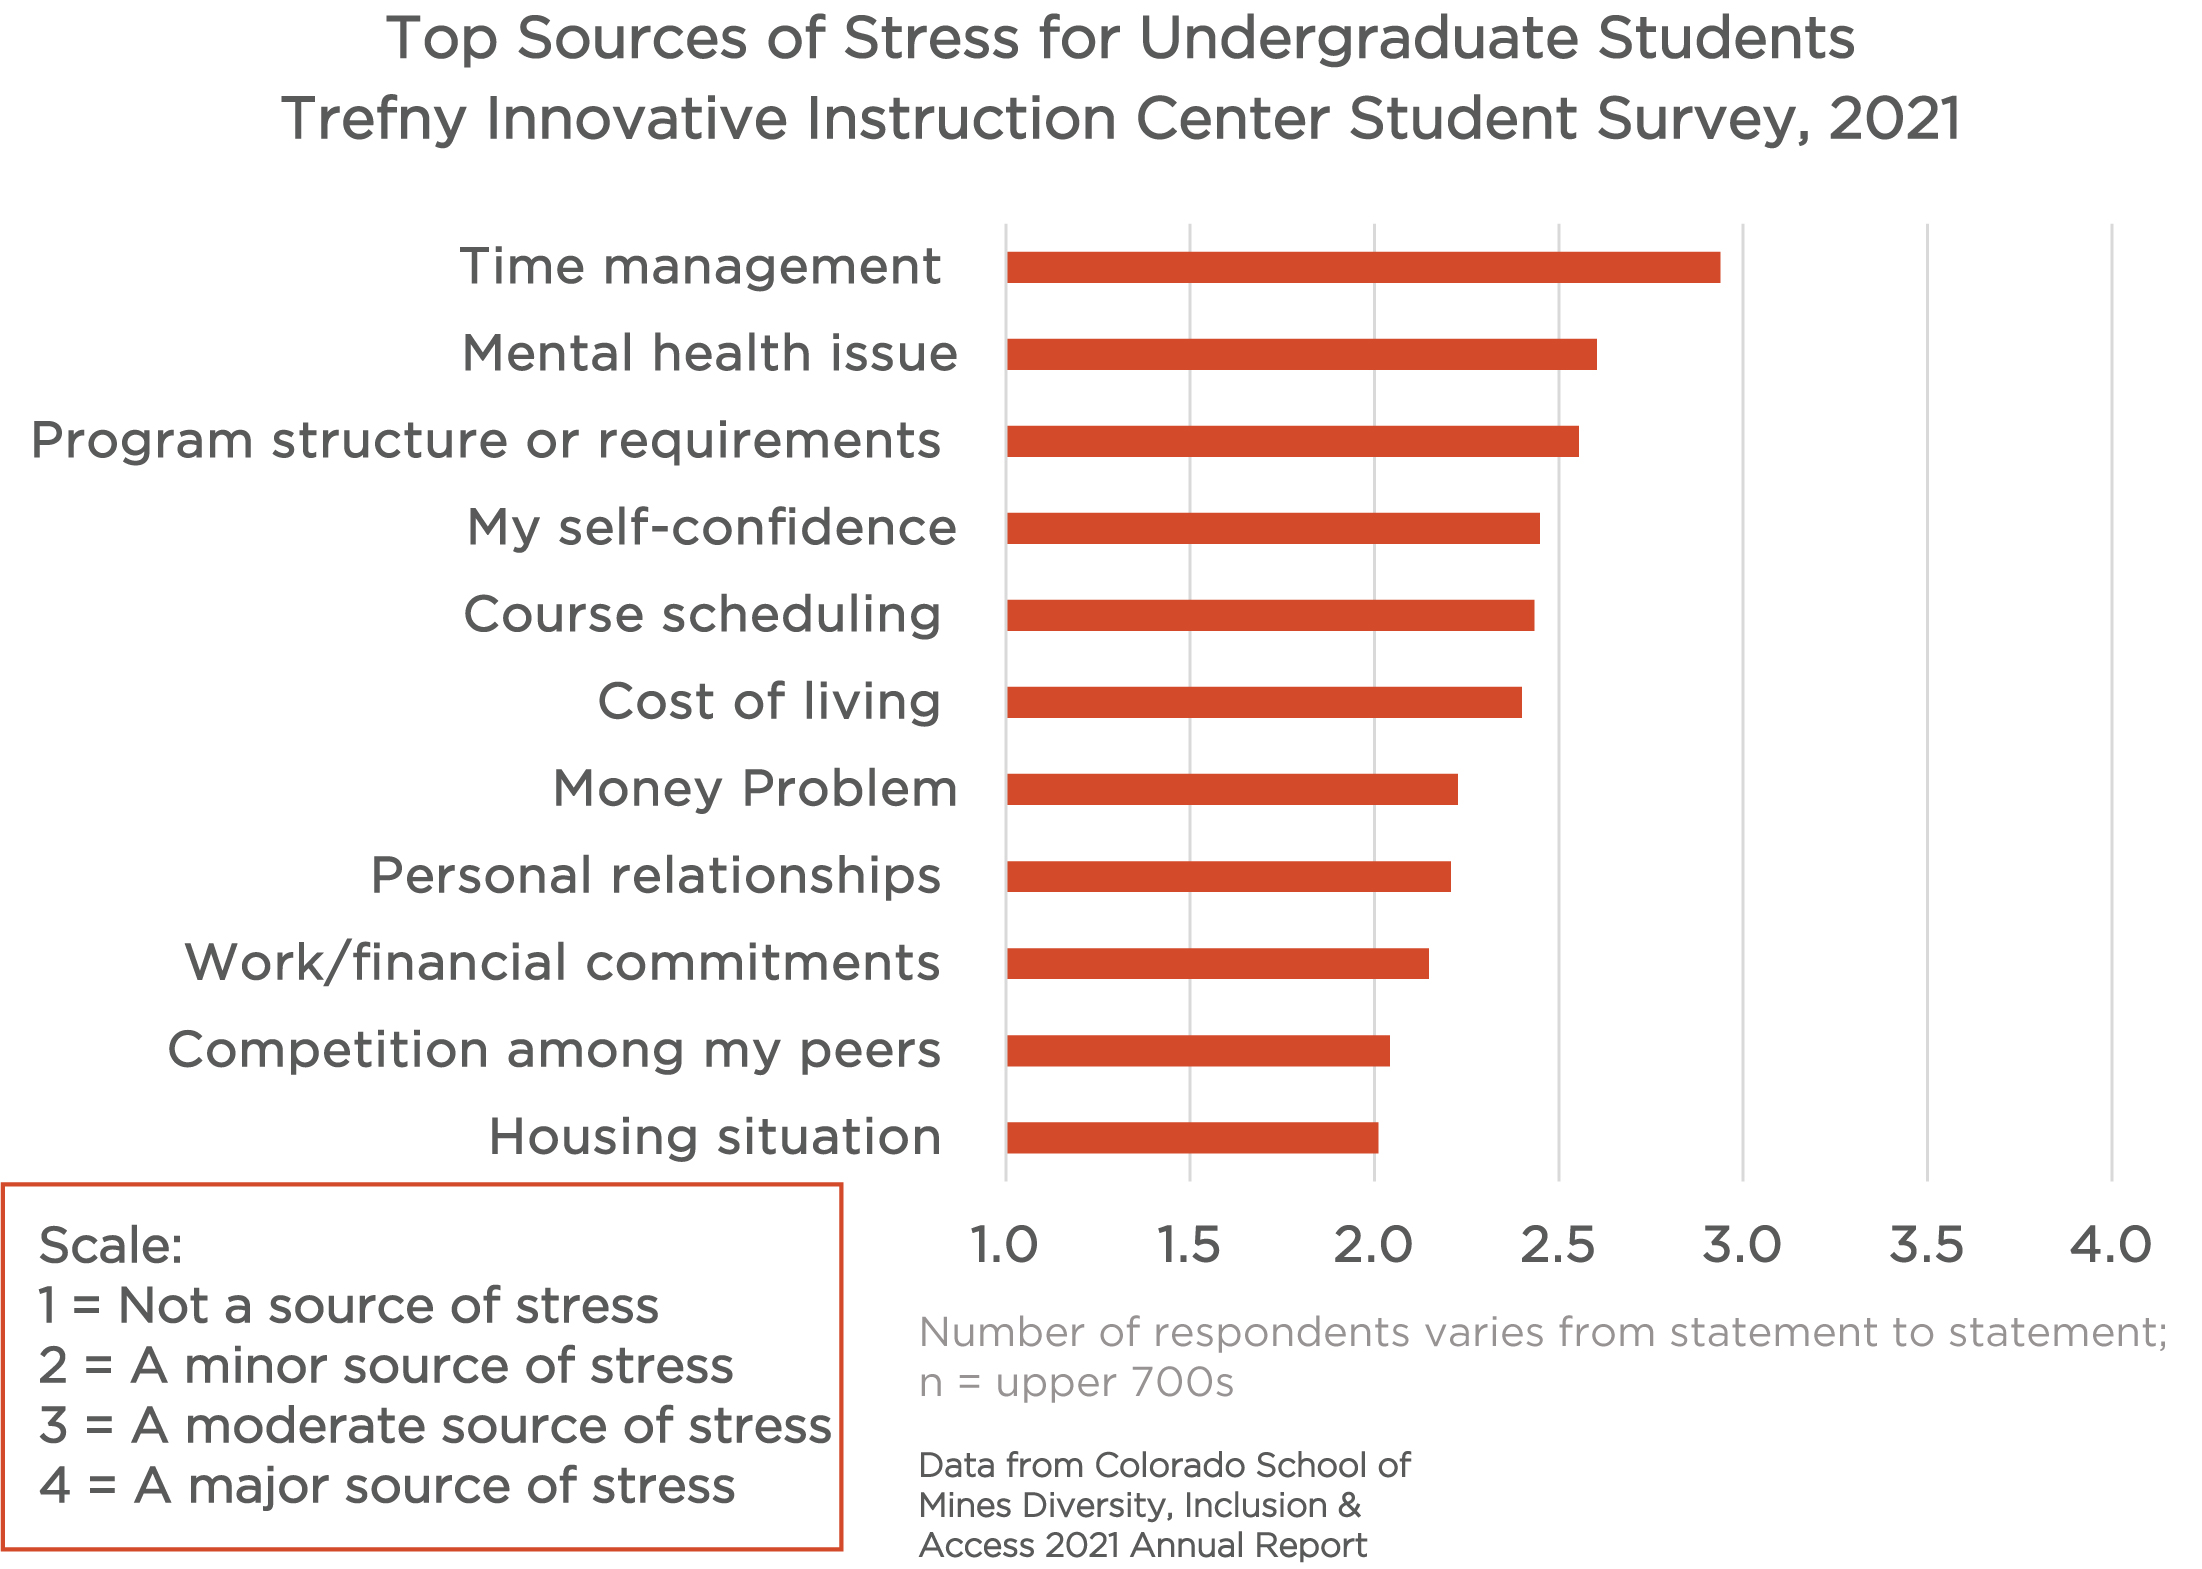 Click on graph image to view larger size Click on graph image to view larger size |
Graduation Data
In addition to highlighting the demographic composition of our 2021 Bachelor’s degree graduates and the 6-year graduation rates from the fall 2015 cohort, we wanted to do a deeper dive into how Mines compares to STEM degrees awarded broadly across the U.S. in 2018. This dataset includes Bachelor’s degrees as well as Doctoral degrees. Investigating data from the National Science Foundation (NSF) at a more granular level, we find out how Mines compares nationally within different science and engineering disciplines. These data were analyzed by demographics to compare gender and race/ethnicity trends. Furthermore, we compare these data to the resident population of the U.S. within a comparable timeframe. Open this PDF to learn more about how Mines compares by discipline to NSF national data and U.S. resident demographics.
| The percentages found in the table are proportionate to the overall student demographics for this population. To review Mines’ new and continuing graduate student demographics, go to the introduction in the annual report (include the link formatted in the text). These data include those who graduated in spring 2021, summer 2021 or fall 2021 with a Bachelor’s degree. Underrepresented is denoted by “URG” and include American Indian/Alaskan Native, African American/Black, Asian, Hispanic/Latinx, multiple races and Native Hawaiian/Pacific Islander populations. Gender is defined here as only either male or female due to limitations in data collection and reporting. |
|
||||||||||||||||
| Most current data from the National Center for Education Statistics (NCES) show that for a starting cohort in fall 2013, the graduation rate of first-time, full-time bachelor’s degree seeking students at 4-year institutions was 63% for all public, private and for profit institutions. At Mines, our students greatly exceed that graduation rate with rates consistently in the 82%-84% range for all student populations. Gender is defined here as only either male or female due to limitations in data collection and reporting. |
*Data are missing/not included to protect confidentiality |
||||||||||||||||||||
|
The percentages found in the table are proportionate to the overall student demographics for this population. To review Mines’ new and continuing graduate student demographics, go to the introduction in the annual report (include the link formatted in the text). These data include those who graduated in spring 2021, summer 2021 or fall 2021 with either a graduate certificate, a postbaccalaureate certificate or a degree from a Master’s non-thesis program. Underrepresented is denoted by “URG” and include American Indian/Alaskan Native, African American/Black, Asian, Hispanic/Latinx, multiple races and Native Hawaiian/Pacific Islander populations. Gender is defined here as only either male or female due to limitations in data collection and reporting.
|
|
||||||||||||||||||
| The percentages of female and URG students graduating from thesis-based programs are only slightly lower than their representation in the overall new and continuing student demographics for fall census 2021. Since it takes considerably longer to graduate with thesis-based degrees with more variability from semester to semester, the proportion of students graduating at any given year could vary slightly compared to the current fall census. To review Mines’ new and continuing graduate student demographics, go to the introduction in the annual report (include the link formatted in the text). Underrepresented is denoted by “URG” and include American Indian/Alaskan Native, African American/Black, Asian, Hispanic/Latinx, multiple races and Native Hawaiian/Pacific Islander populations. Gender is defined here as only either male or female due to limitations in data collection and reporting. |
|
||||||||||||||||||
Employee Retention
Employee turnover data are from fiscal years 2015 through 2021. Mines defines a fiscal year to start July 1st and end June 30th each year. The data are grouped by major employee classifications. Academic Faculty include Tenure/Tenure Track faculty, Teaching Faculty and Professors of Practice. Data for administrative faculty include administrative, athletics and library faculty (note: Library faculty are Academic Faculty per the Faculty Handbook, but are classified in Banner as administrative faculty) . Classified staff here includes the classified monthly employees.
Generally speaking, there was an increase in turnover rates from FY 2019 to FY 2020 of Administrative Faculty, an artifact most likely due to the pandemic. Furthermore, there was an observed increase in turnover rates of our female administrative faculty of color, reflecting a common trend found in the overall workforce in the U.S. during the pandemic. This observation is not isolated to the Mines community.
Navigate through the following tabs to study the turnover trends more closely for each employee class.
| Overall, there is generally low Academic Faculty turnover. What’s important to note is that turnover rates of our academic faculty of color (URG) remain particularly low, if not at 0%, for most fiscal years. Both female and male academic faculty also have comparable turnover rates, with an exception in FY 2019 when we observe a spike of 5.3% in female turnover. Surprisingly, turnover rates for female academic faculty drop back down to 1.0% in FY 2020 during the pandemic. Underrepresented is denoted by “URG” and include American Indian/Alaskan Native, African American/Black, Asian, Hispanic/Latinx, multiple races and Native Hawaiian/Pacific Islander populations. Gender is defined here as only either male or female due to limitations in data collection and reporting. | 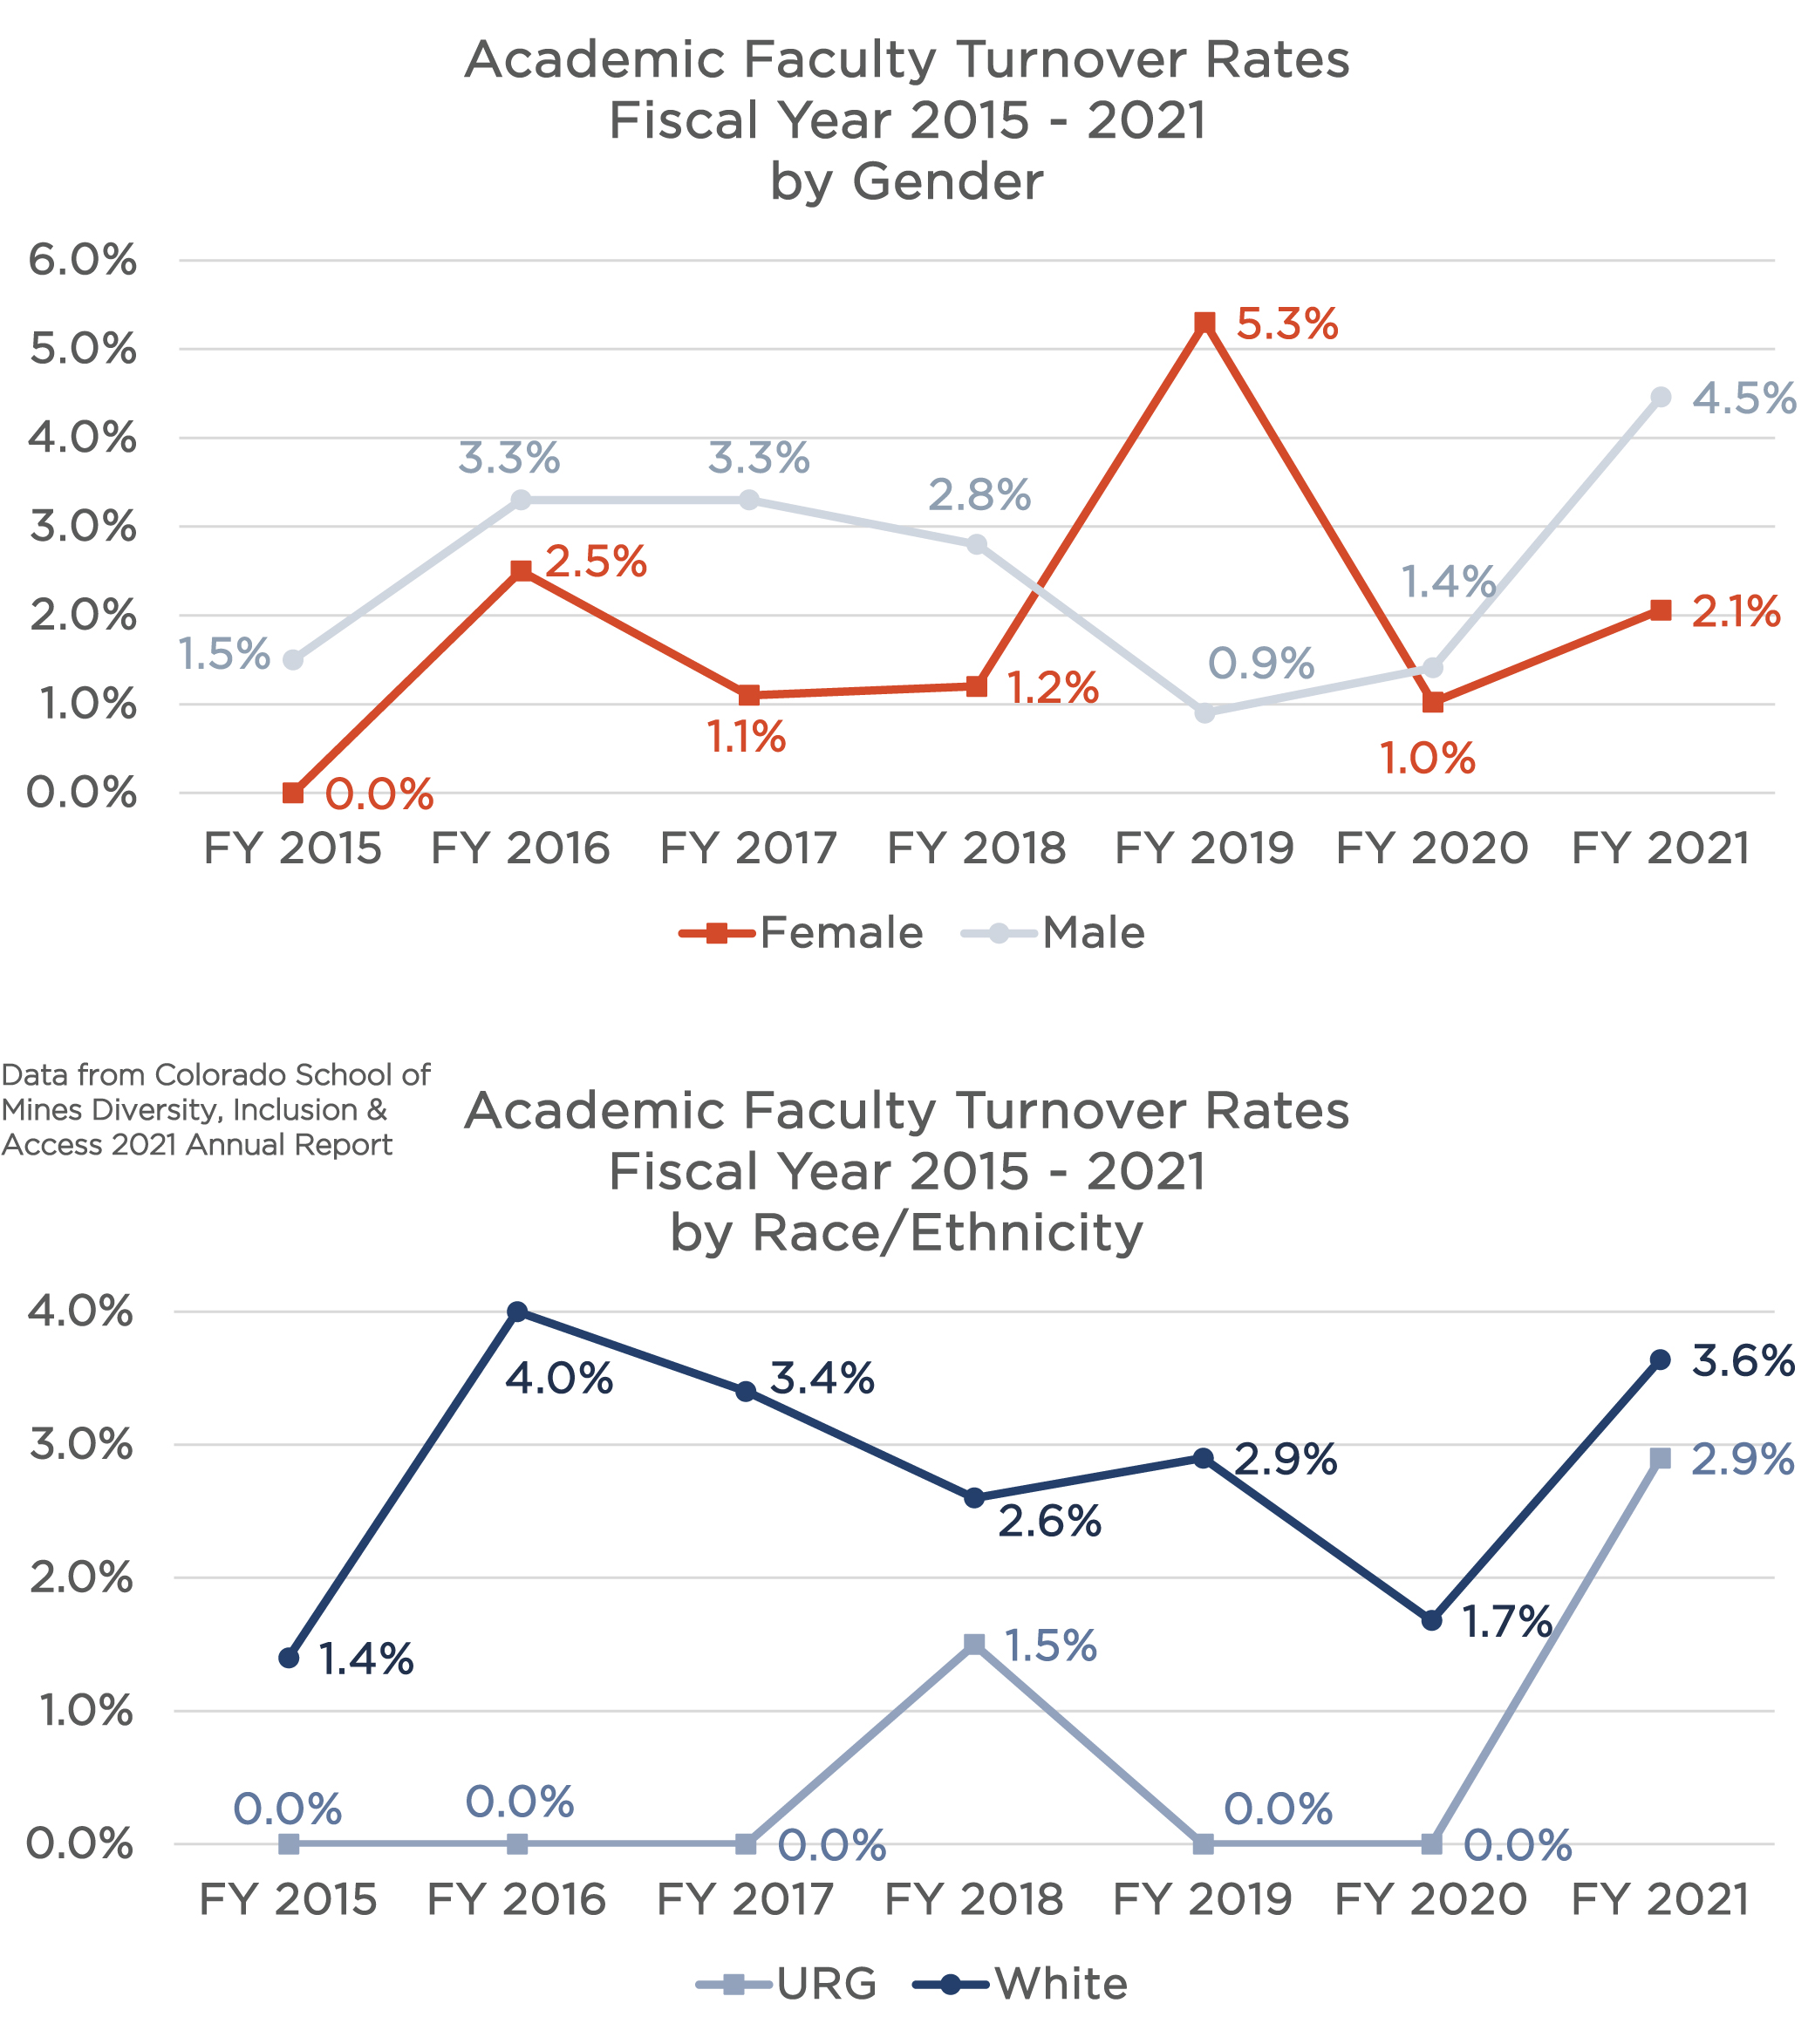 Click on graph image to view larger size Click on graph image to view larger size |
| Administrative Faculty have higher turnover overall compared to Academic Faculty. Turnover rates increased in FY 2019 and 2020 for both male and female employees, but particularly for male employees. Turnover rates by race and ethnicity show that employees of color (URG) left Mines at much higher rates compared to white employees in FY 2018, 2019 and 2020. This trend started prior to the pandemic but then during the pandemic, there was notably less turnover in FY 2021 for employees of color. Underrepresented is denoted by “URG” and include American Indian/Alaskan Native, African American/Black, Asian, Hispanic/Latinx, multiple races and Native Hawaiian/Pacific Islander populations. Gender is defined here as only either male or female due to limitations in data collection and reporting. | 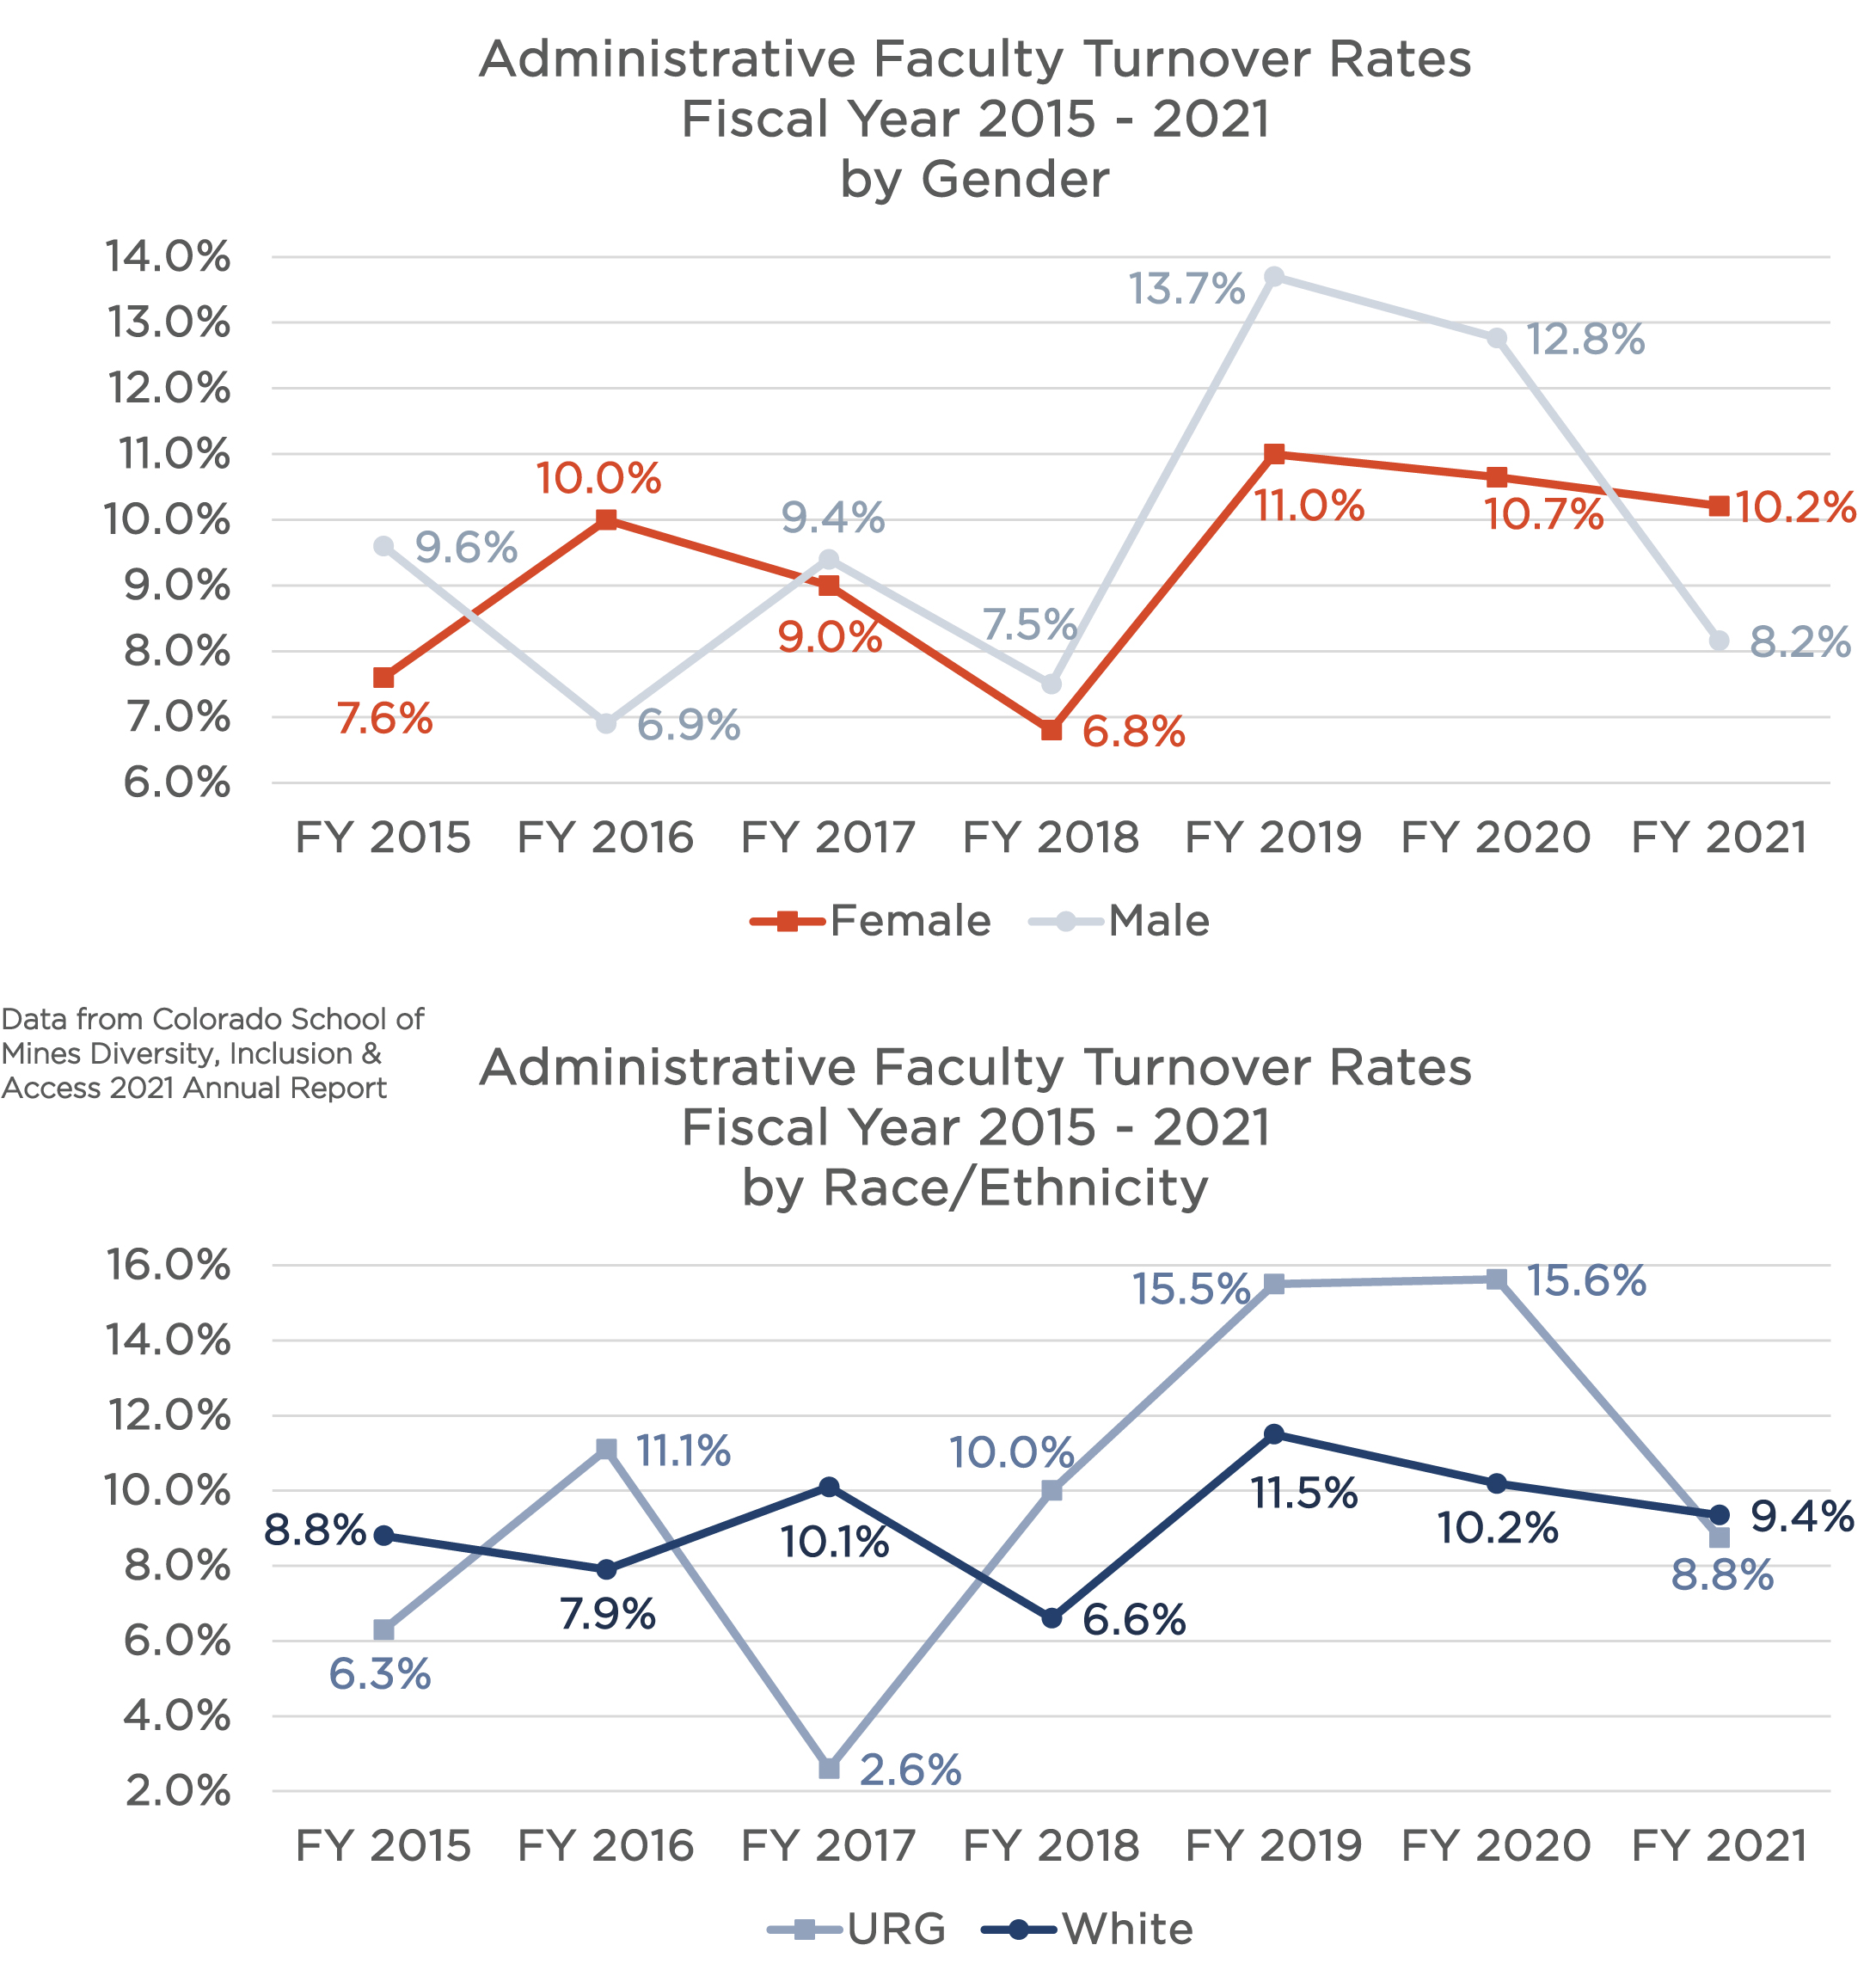 Click on graph image to view larger size Click on graph image to view larger size |
| Turnover rates for Classified Staff are the highest of all the employee classes. There was a spike in turnover for female staff in FY 2017, but then dipped down to prior levels since that time. Turnover by race and ethnicity shows a clear difference between our staff of color and our white staff. White staff have consistently lower turnover compared to staff of color, demonstrating that Mines has an opportunity to investigate why this may be happening and provide additional resources, training or investigate culture and climate issues within the ranks to reduce turnover for these populations. Underrepresented is denoted by “URG” and include American Indian/Alaskan Native, African American/Black, Asian, Hispanic/Latinx, multiple races and Native Hawaiian/Pacific Islander populations. Gender is defined here as only either male or female due to limitations in data collection and reporting. | 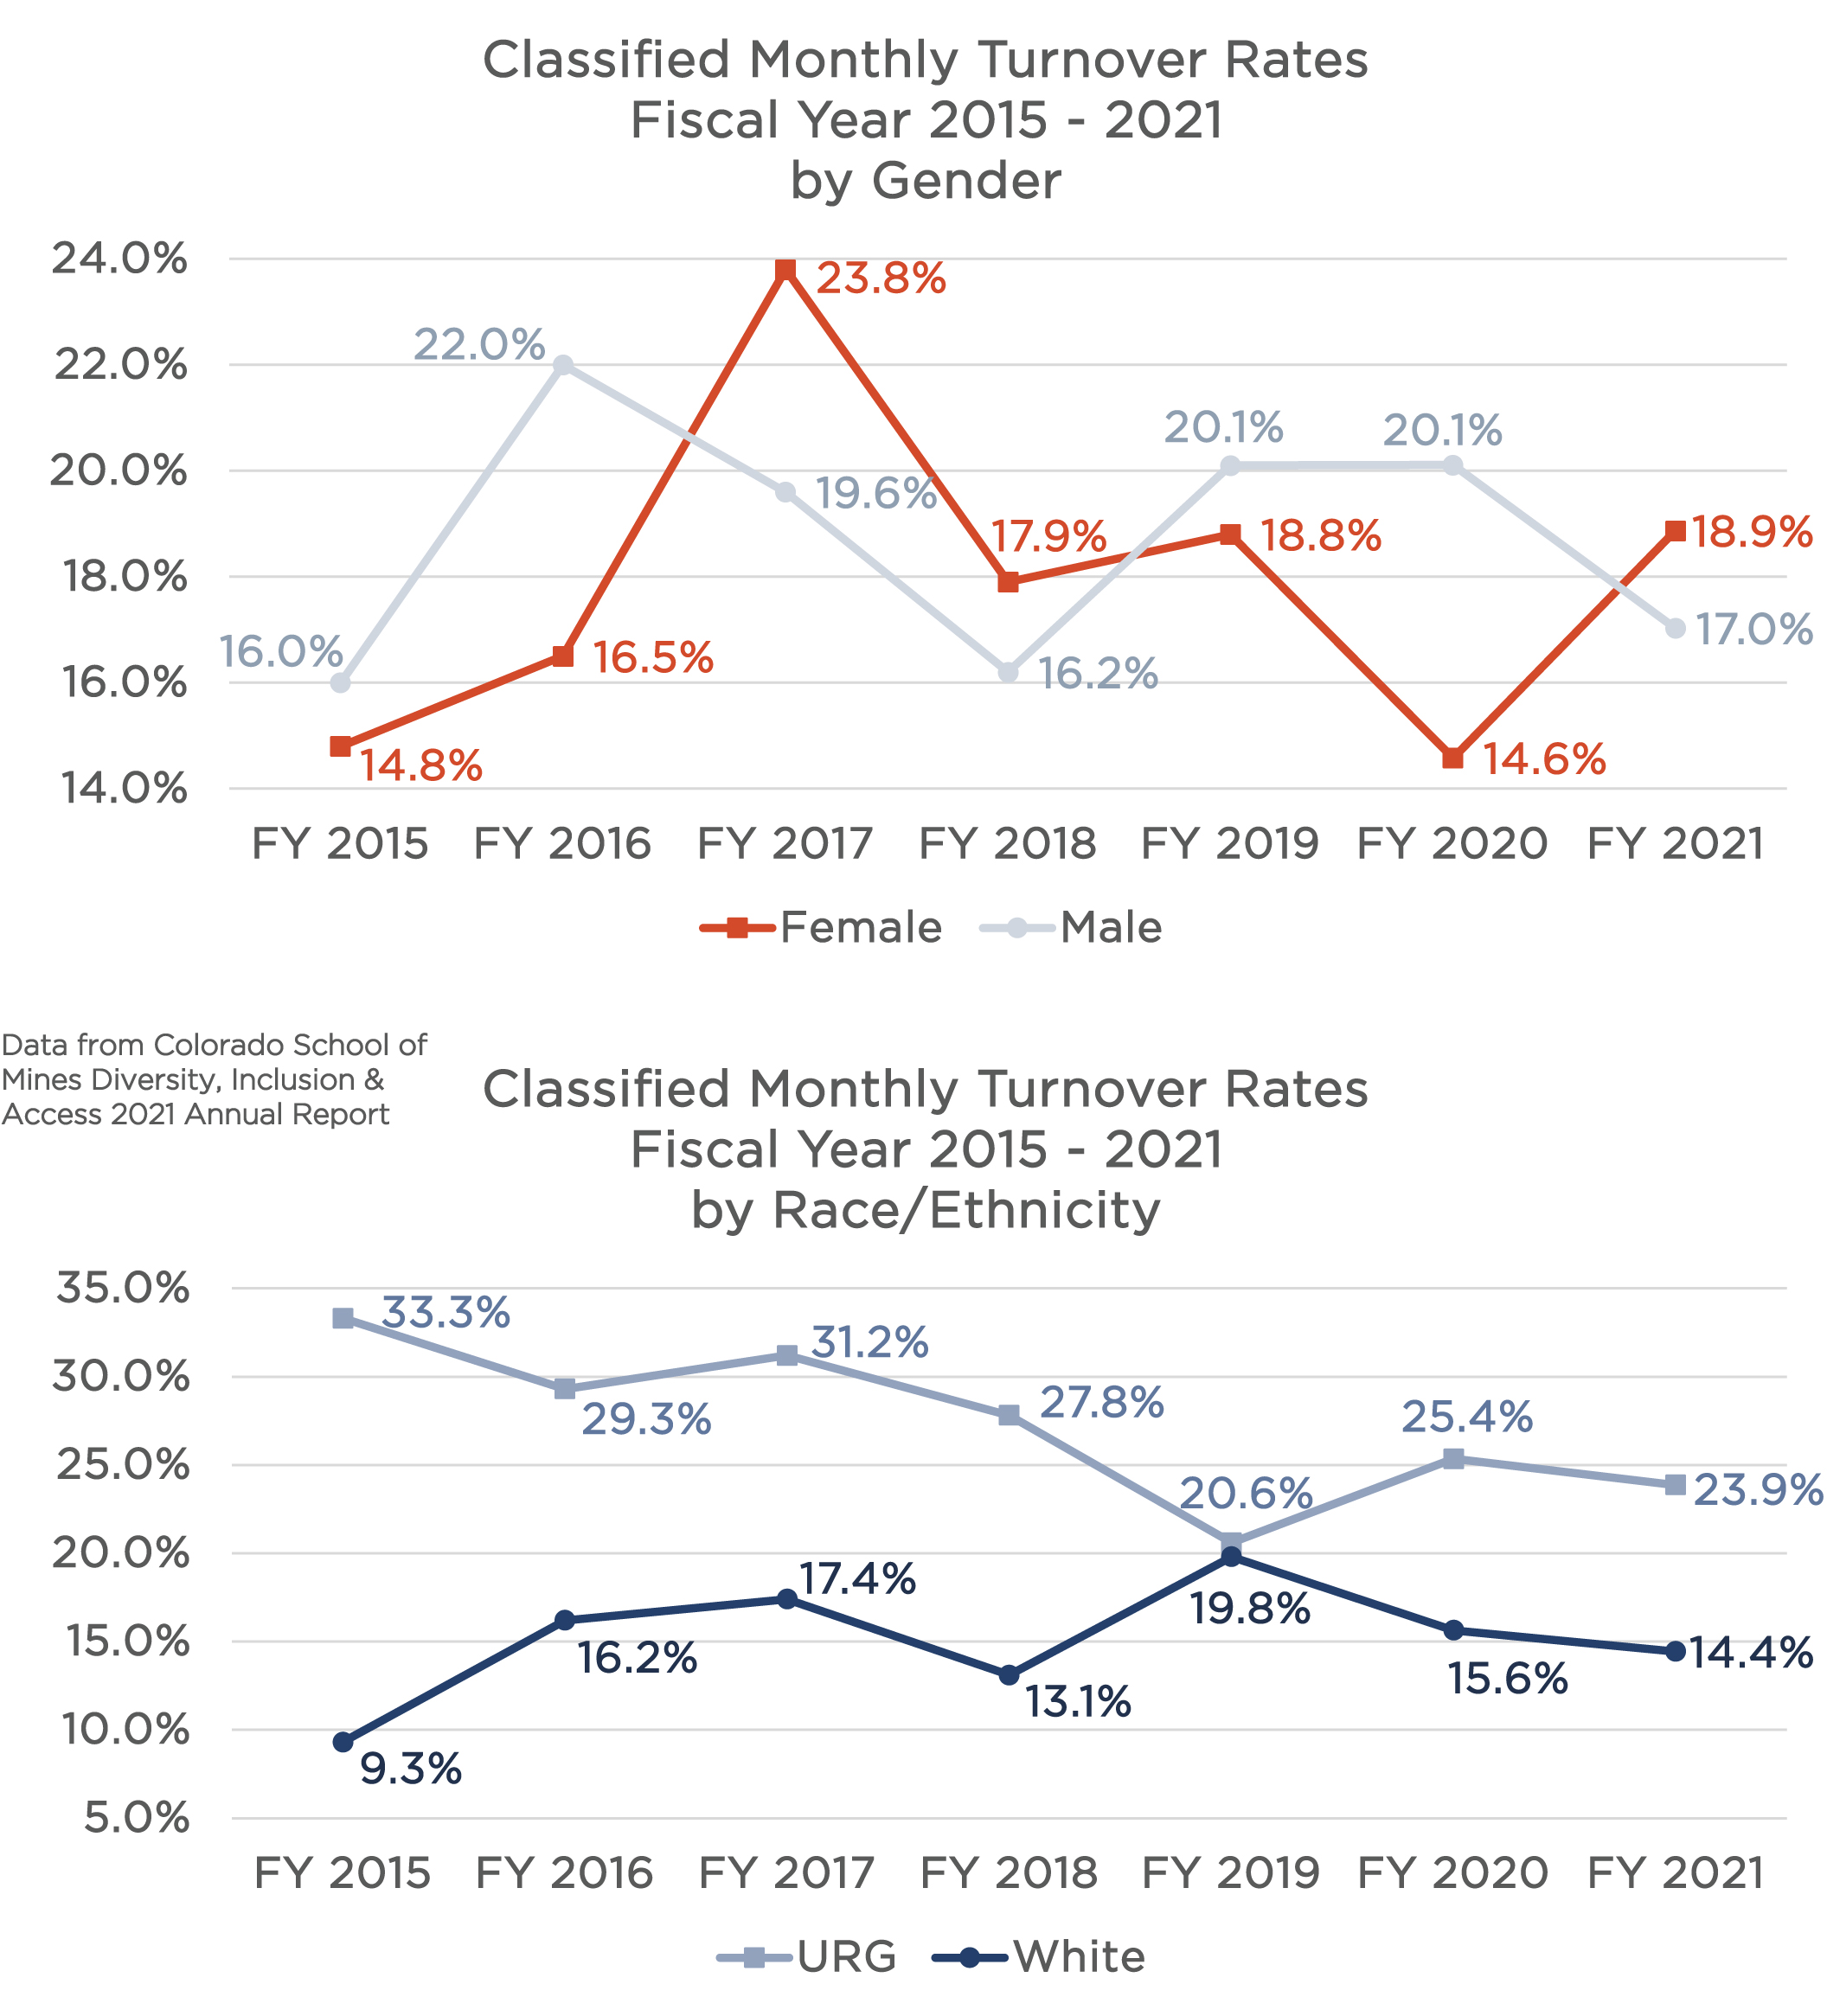 Click on graph image to view larger size |
Evaluate the current Advising Structure for students and consider new models to support retention
Mines researched advising best-practices and developed a four-year, professional undergraduate advising center. Effective fall 2020, all undergraduate students are professionally advised through the Center for Academic Services and Advising (CASA) from orientation until graduation and maintain mentoring support from faculty across campus. By transferring professional advising to CASA, students receive consistent and high-quality holistic advising and academic support services. These include tutoring, connection with faculty and academic coaching for topics such as time management and study skills. CASA staff are well-at tuned to factors that increase students’ risk of leaving Mines and proactively support students who are either at risk or are struggling with their academics.
One example we’d like to highlight is the University Honors and Scholars Programs (UHS). They have updated their approach to supporting students and are trying a new model to support retention.
UHS is home to six cross-cutting academic programs with affiliated curricular, co-curricular and extracurricular components that are open to all students regardless of disciplinary major, pre-existing experience or background: the Thorson First-Year Honors Experience (TFYHE), the Grandey First-Year Honors Experience (GFYHE—program pilot fall 2021), the McBride Honors Program in Public Affairs, Undergraduate Research Scholars (URS), the Grand Challenges Scholars Program (GCSP) and Teach@Mines. Diversity, Inclusion, & Access (DI&A) is essential to UHS. We must have a diverse, inclusive and accessible culture in order for UHS to create inspiring, interdisciplinary pathways of distinction that foster a sense of fulfillment for our students, faculty and staff. In order to generate opportunities for students to follow their passions and facilitate curricular and co-curricular learning that construct deeper and broader experiences beyond disciplinary and technical expertise, we need to ensure that different ways of thinking, various life experiences, inclusiveness and accessibility are not only honored but foundational to our programs. Creativity, inspiration and innovation cannot be achieved without a diverse and welcoming community. We have also broadened our DI&A team to include the students in our programs by providing learning opportunities, workshops and leadership training to help co-create and affect positive change in the classroom and the broader community. For more information about UHS, go to the homepage.
One grass-roots initiative to bolster student retention is an effort by Computer Science students at Mines. Students in the local chapter of the Association for Computing Machinery (ACM) started the ACM Mentorship Program. It is designed to connect underclass students (first-years and sophomores) with upperclass students (juniors and seniors) in the CS@Mines community. Upperclass students have a wealth of knowledge about choosing classes, finding internships, developing software in industry and more, but underclass students don’t get many opportunities to interact with upperclass peers. The ACM Mentorship Program is designed to close that gap, so they can learn from upperclass students and upperclass students can share what they wish they had known when they were starting their degree program.
The program started in fall 2021 and only involved a couple of mentors and mentees. However, the feedback from mentees was overwhelmingly positive and there is interest from both prospective mentors and mentees to join the program next year. To further develop the program, ACM now has an officer position for the “Director of Mentorship,” and this officer will work on improving and expanding the program based on feedback and lessons learned from the inaugural year of the program.
Mines Mentoring Program
The Oredigger Network, a Mines-wide mentoring program, was introduced to campus in Fall 2020 thanks to a generous donation from Phillips 66. The program connects business professionals with Mines students, employees and alumni in a 180-day mentoring experience or one-time “flash” mentoring. At the start of each academic semester, mentee and mentor pairs enter a connection curriculum specifically designed for the STEM audience and are supported by over 30 conversation guides to help mentors assist their mentees as they make progress on their professional or personal goals. The 2020 -2021 program outcomes report highlights year one’s data and establishes baseline data for future years.
The Mines Mentoring program enriches the preparation and experiences of aspiring entrepreneurs (Entrepreneurs @ Mines) and serves to welcome and orient new Mines faculty to our community (extended onboarding).
We invite mentors to lend their time and expertise to Mines students, employees and alumni; connect with Orediggers to help grow their knowledge and network in ways that are proven to energize their careers; and offer student entrepreneurs and new faculty an enriching and supportive mentor-led community.
Equal Pay for Equal Work
In early 2018, Governor Polis signed into legislation, the Colorado Equal Pay for Equal Work Act, part of which imposes transparency obligations related to promotion and advancement. Mines has made great progress in the Equal Pay for Equal Work requirements that came into effect January 1, 2021. It requires protections for employees regarding pay discrimination based on sex, prohibits seeking wage history as a condition of employment, requires promotion postings and job announcements to include hiring ranges and it requires employers to maintain job descriptions and wage history for all employees.
As part of the progress, Mines verified job descriptions, looked at benchmarking for all positions to create a hiring range and made equity adjustments to those employees who did not meet the minimum benchmarks within their job classification. The next step is to do an internal statistical equity analysis to verify employees are paid appropriately for their work based on the EPEW compensable factor requirements. This work will start in fall 2022.
Mines is also establishing a pay philosophy, salary structures and standardize job titles and job descriptions that will assist in the EPEW requirements.
ines remains committed to ensuring representation of employees in leadership positions. There is an opportunity for growth, particularly for employees of color in leadership positions. This trend greatly aligns with the common challenges the STEM disciplines face in increasing representation and broadening participation of scientists and engineers of color. The following data show the demographic breakdowns, by gender and then race and ethnicity, of employees in three leadership categories from December 2021: (1) Executive Leadership are those in the VP level and above; (2) Deans and AVPs are academic Deans and Associate Vice President levels; (3) Department Heads within the academic departments.
Student Life leadership, as part of their DI&A strategic vision work, proposed a new leadership role in the FY22 budget request. The funding for this position was approved and the role was filled by Sheena Martinez who is now the Assistant Vice President of Student Life for Equity and Engagement. This leadership position provides strategic vision, planning and assessment of diversity, inclusion access and equity efforts, especially pertaining to the co-curricular and extra-curricular student experience, student services and student community and engagement outside the classroom throughout the Mines community.
The Multicultural Engineering Program has new leadership, Dra. Stepheny Beauchamp serves as the Director and Kayla Tanaid serves as the Assistant Director. They are both honored to continue their work in serving and supporting students from underrepresented communities at Mines. They look forward to working with folks across campus to create a diverse and inclusive learning community, enroll and graduate underrepresented students and continue to build a community of support through Mines’ many partnerships.
| This graph shows the gender breakdown of Mines leadership for Executives, Deans and Associate Vice President levels and Department Heads from a freeze date in December 2021. At the two highest leadership levels, female employees held nearly half of leadership positions, whereas for Department Heads, they held slightly less than a third. Gender is defined here as only either male or female due to limitations in data collection and reporting. | 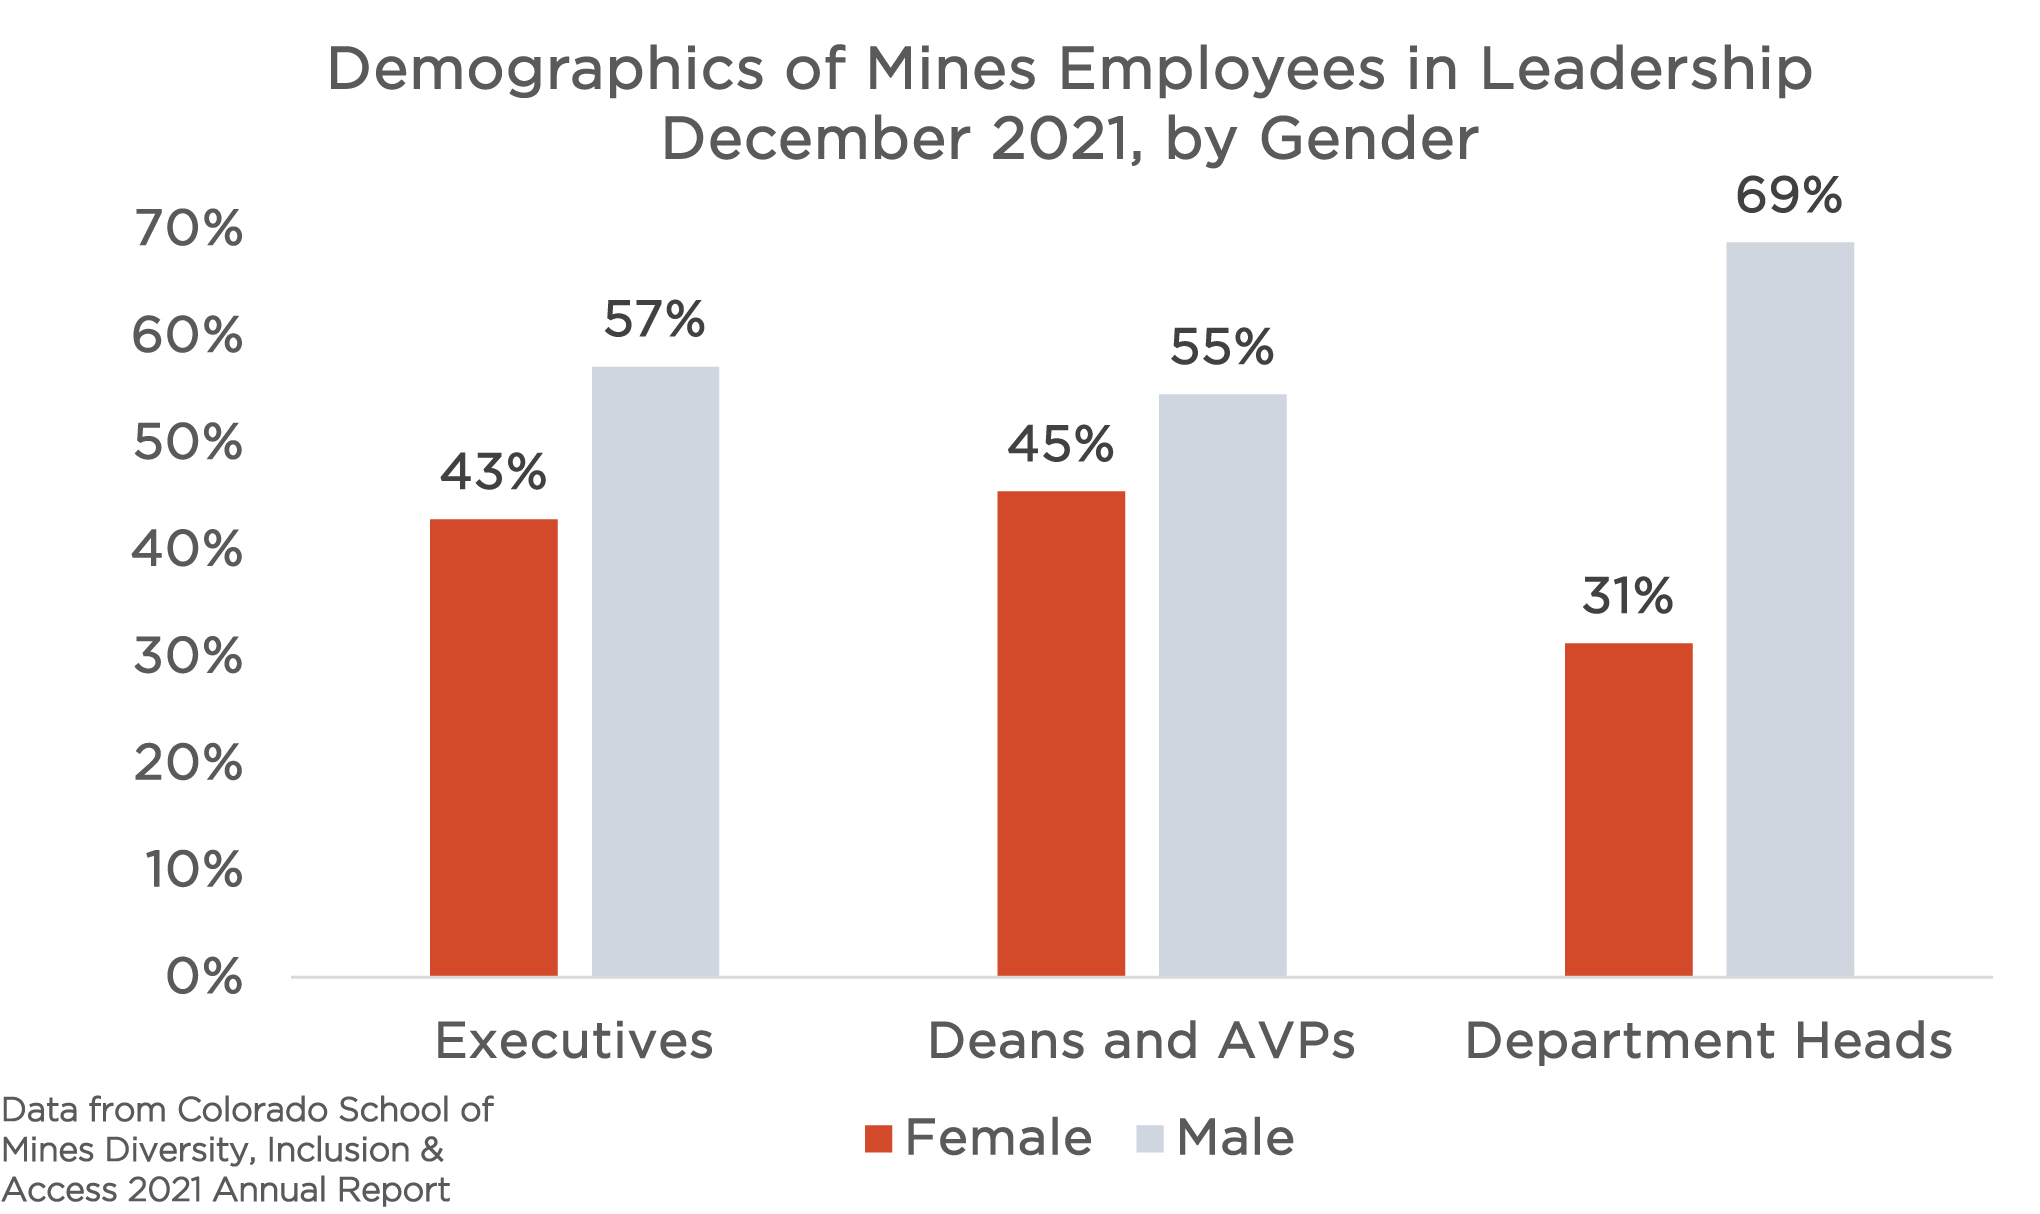 Click on graph image to view larger size Click on graph image to view larger size |
| This graph shows the race and ethnicity breakdown of Mines leadership for Executives, Deans and Associate Vice President levels and Department Heads from a freeze date in December 2021. Overall, Mines has proportionately fewer leaders of color compared to those who identify as white. However, many, if not most, of these positions come from academically-focused career pathways. Thus, these percentages or URG employees in leadership positions are comparable to the proportion of underrepresented academic faculty and thesis-based graduate student populations, who tend to be the source of talent to fill these levels of positions during their mid-to-late career stages. Underrepresented is denoted by “URG” and include American Indian/Alaskan Native, African American/Black, Asian, Hispanic/Latinx, multiple races and Native Hawaiian/Pacific Islander populations. | 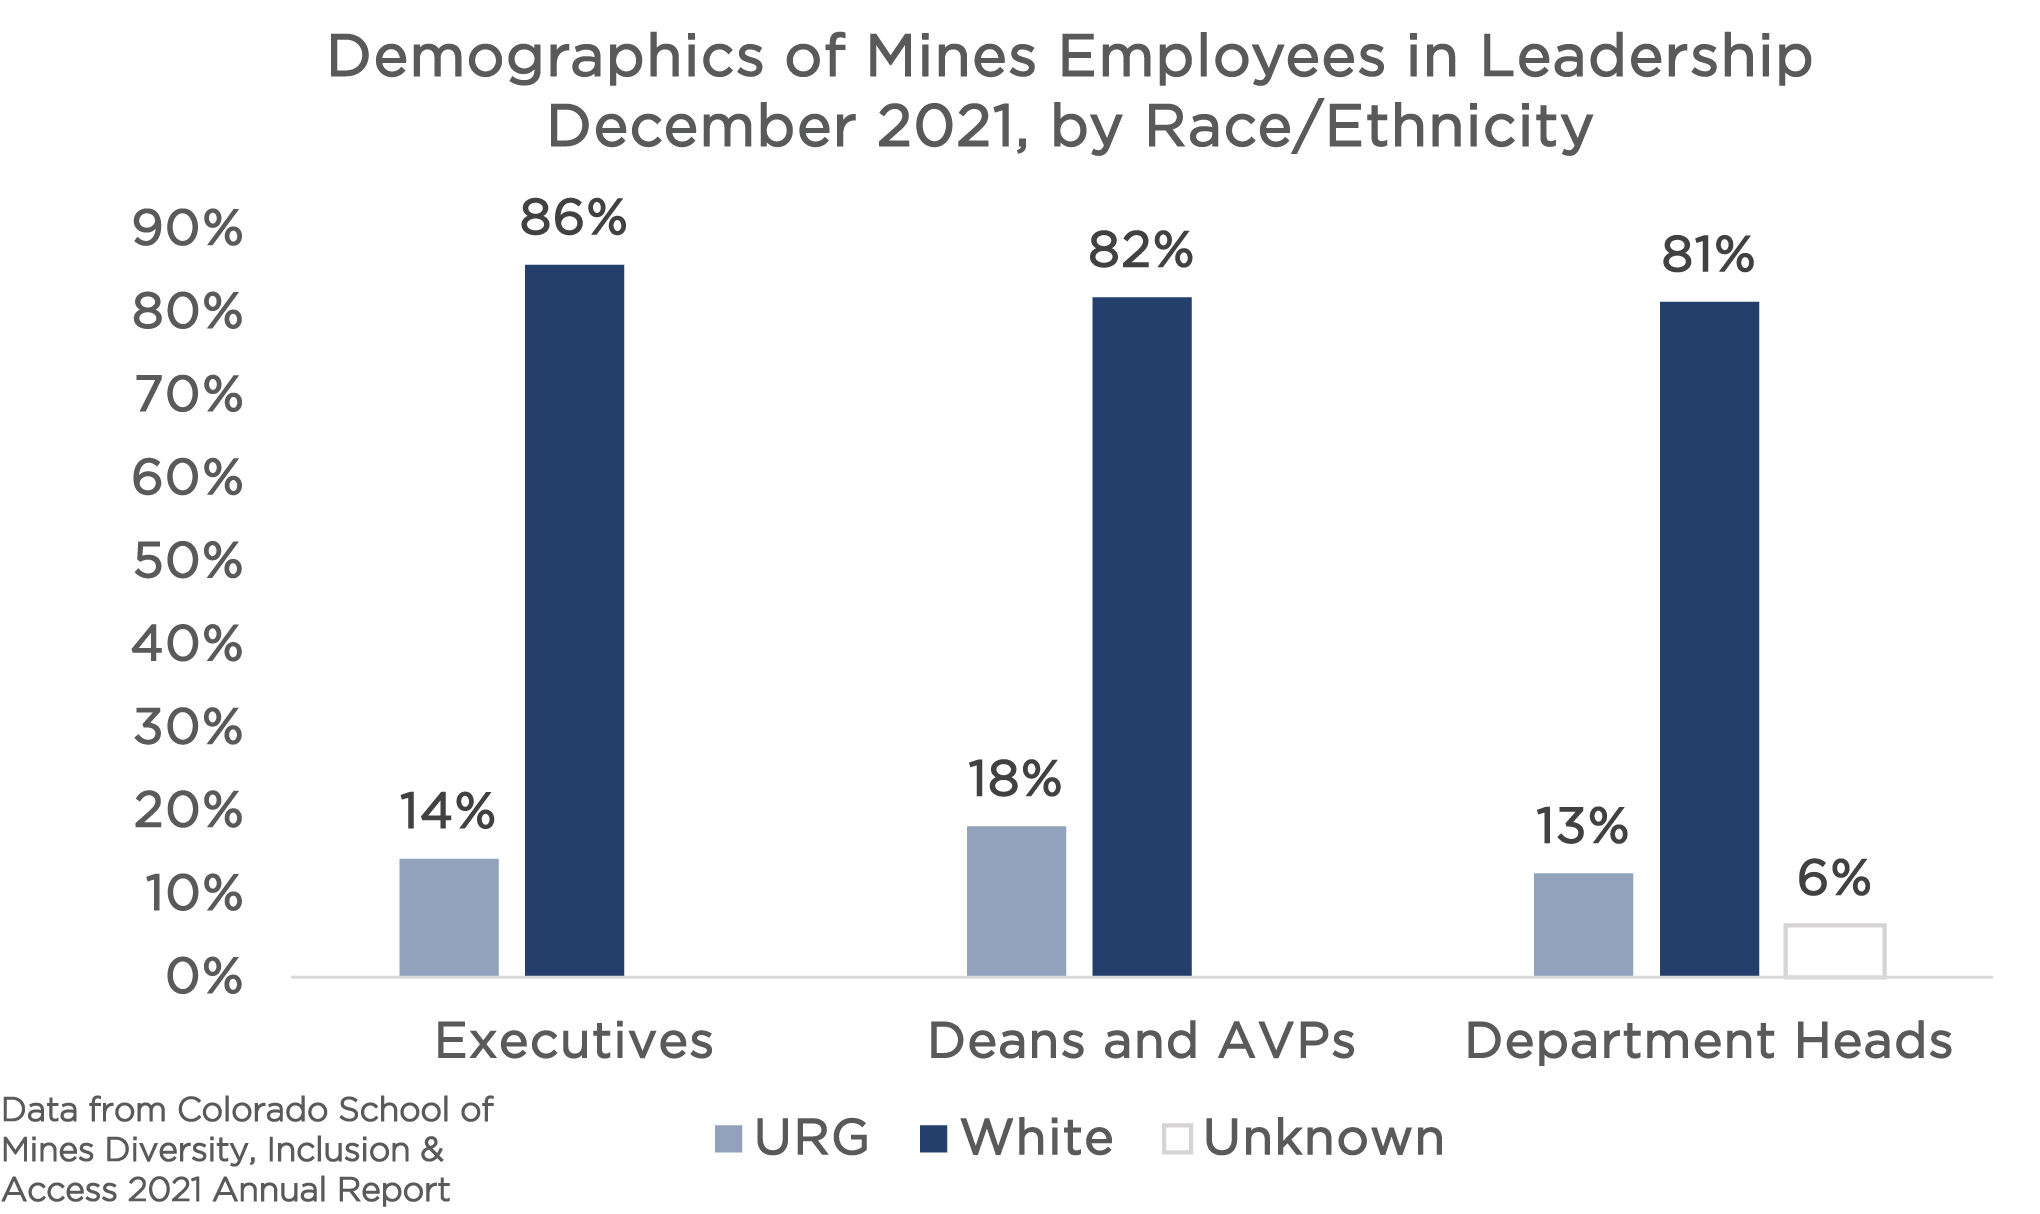 Click on graph image to view larger size Click on graph image to view larger size |
Colorado School of Mines created the “Mines Community Alliances” (MCAs) in 2019, modeled after industry’s Employee Resource Groups (ERGs). MCAs are employee-run groups, sponsored by a representative in executive leadership, to support the professional development of its members. MCAs align with Mines’ strategic initiative to build a high-performing organization and create an inclusive workspace for all Orediggers. The focus of MCAs is to engage members, provide professional development and networking opportunities, raise cultural awareness for marginalized groups and provide opportunities for community involvement, outreach and recruitment into Mines.
In 2021, the MCAs welcomed an additional group to the existing four – the Mines Asian Community Alliance (MACA). Membership for our five MCAs has been growing.
- Asian MCA has 23 members
- Black MCA has 40 members
- Latinx MCA has 55 members
- LGBTQ+ MCA has 45 members
- Women MCA has 126 members
This year, the MCAs were asked to fill out an evaluation survey to understand the impact MCAs have on their members. The survey was administered to the Black, Latinx, LGBTQ+ and Women MCAs to learn about their experiences from 2020. Three of the four MCAs participated in the survey, with over 60 members in total who answered the questions.
One of the questions asked participants if they were familiar with the purpose of the role of the executive sponsors. The survey found that over 60% of respondents reported that they’re not clear about the role that executive sponsors play for the MCAs. This could be an opportunity for growth and clarity for the future.
Furthermore, one of the questions asked respondents to provide a short answer about why they engage with their MCA. The following items provide insights into the reasons why employees engage with their MCAs:
- To connect with others. This includes building community, connecting with others outside of their own circles, connecting with others within the same identity group or to be a part of social events.
- For professional development. This includes learning from guest speakers, participating in workshops, increasing one’s knowledge or understanding of marginalized groups or to learn how to be a better ally.
- To network.
- To be informed about what’s happening at Mines or to learn about new opportunities at Mines.
- To support others. This includes supporting others within or outside one’s identity group, to support others within a marginalized group as an ally or to receive support from others.
- To help inspire change at Mines and make Mines a better place, usually in reference to marginalized groups.
- To increase awareness of marginalized groups and their representation at Mines.
- To work on efforts related to increasing equity for marginalized groups on campus. This includes the sentiment that the work of MCAs is important for Mines.
- To make a difference. This includes making an impact in our communities, both for Mines’ marginalized communities and in our local Golden/Denver communities through volunteering.
Navigate through the following tabs to find out what else we learned!
- Personal Perspectives and Impacts
- Impacts on Identity-Group Knowledge
- Feelings of Safety
- Outreach Activities
| The evaluation survey asked members about the different potential and anticipated impacts that MCAs could have on members. Overall, there is strong agreement that the MCA meetings are worthwhile to attend. Over 60% of participants agreed that being a member of their MCA increases their sense of belonging at Mines. Furthermore, over 50% of participants agreed that being a member of their MCA positively impacts their desire to stay employed with Mines. | 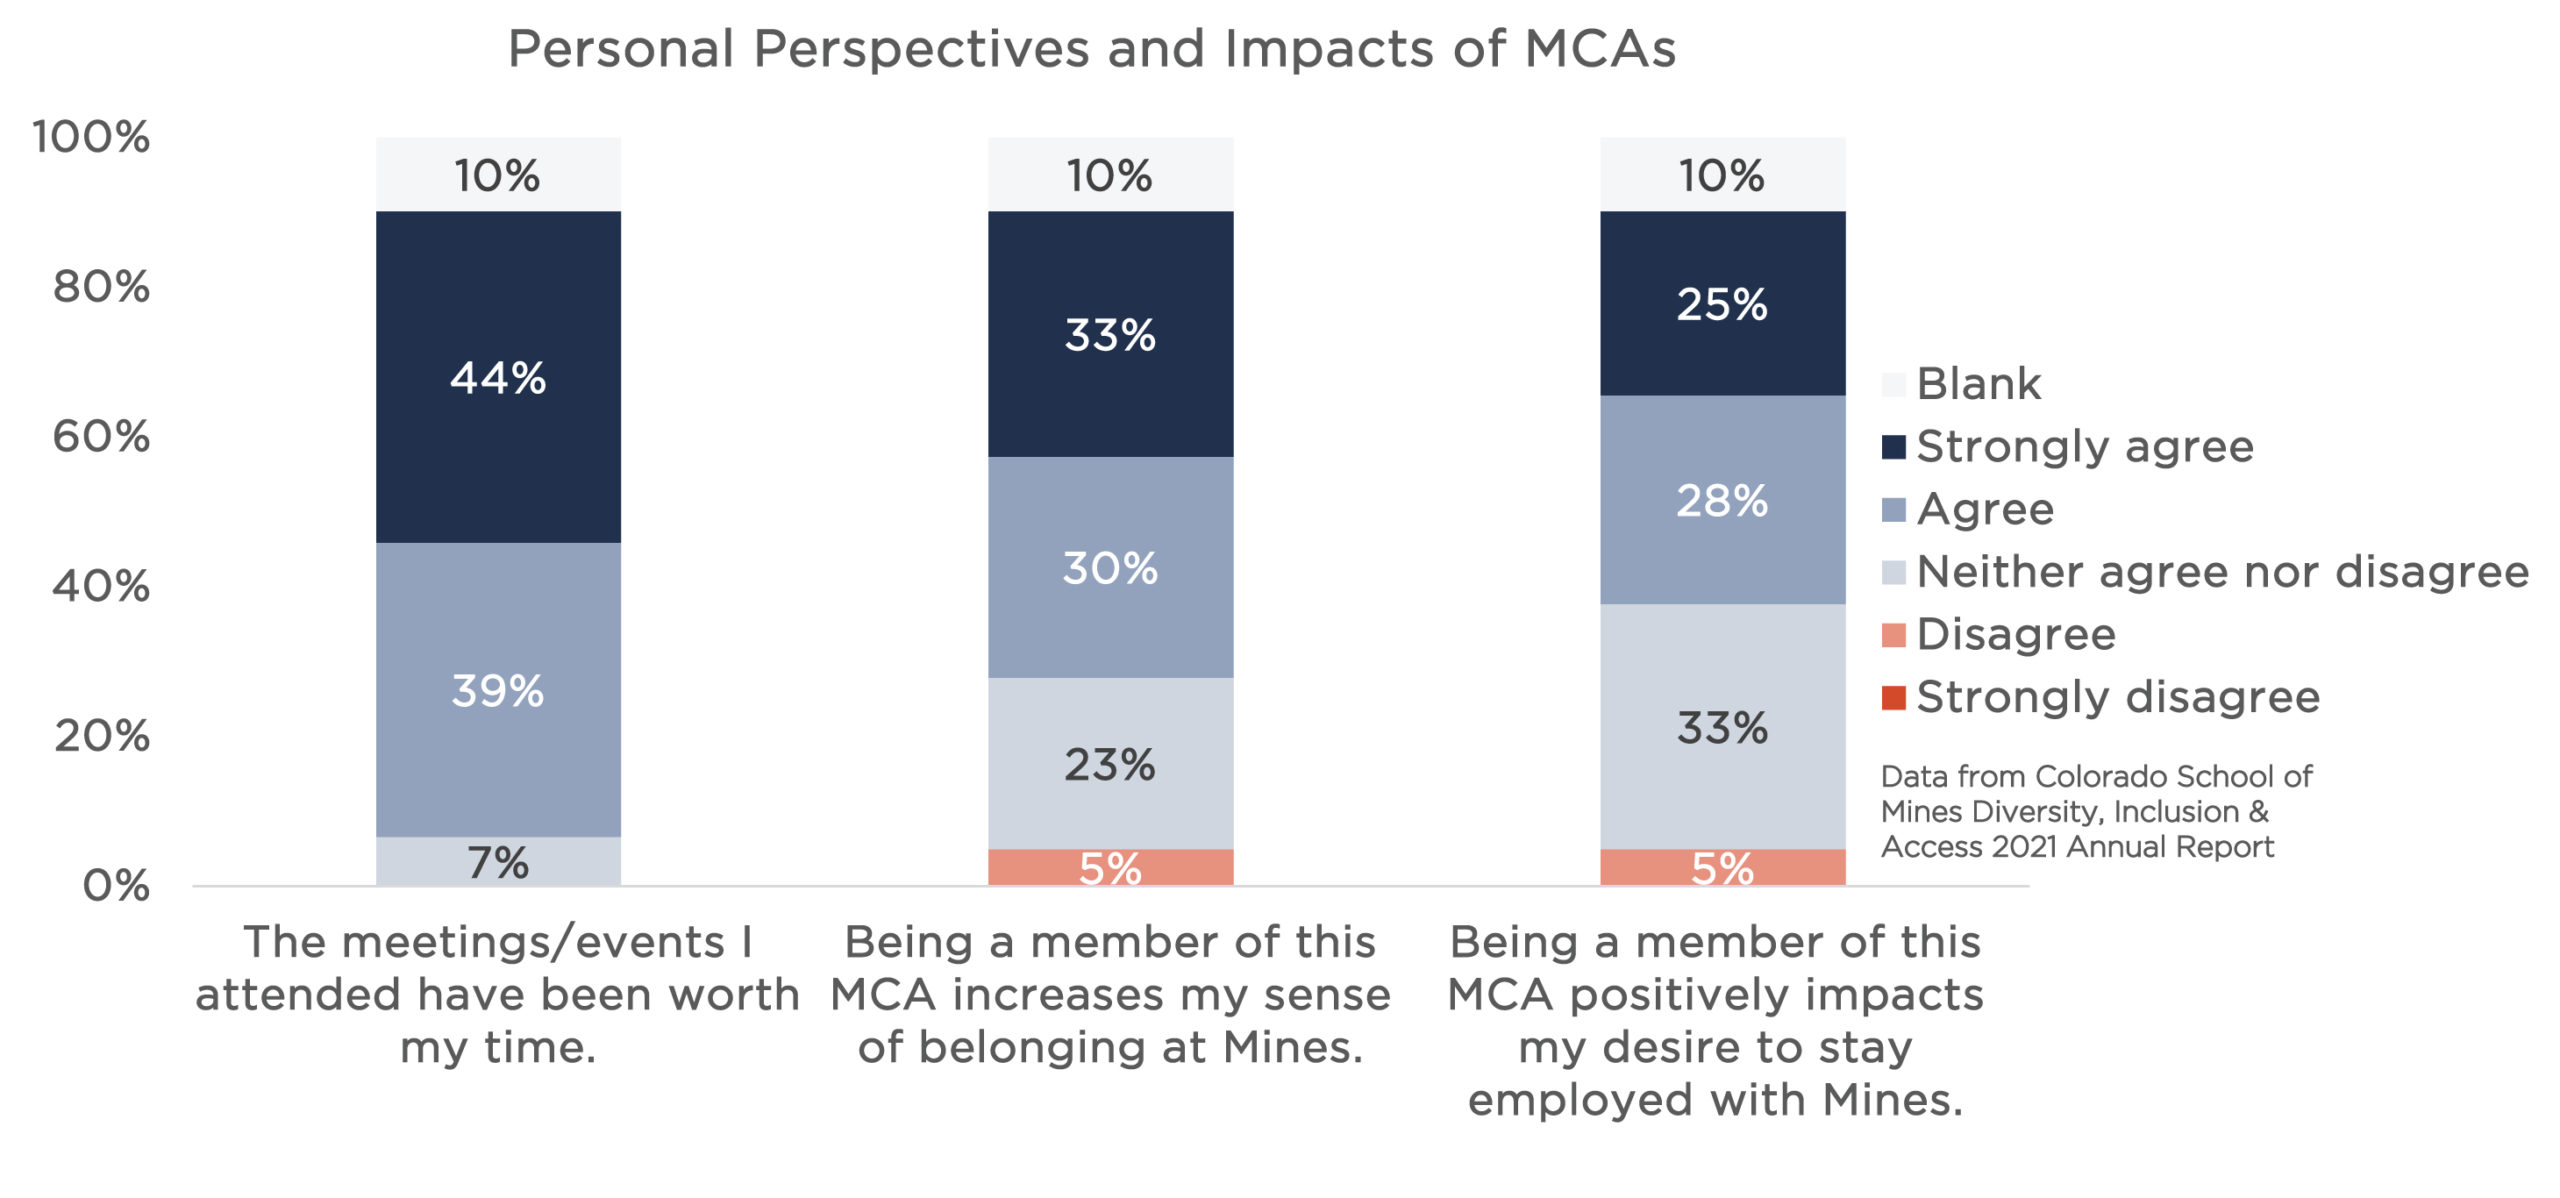 Click on graph image to view larger size Click on graph image to view larger size |
| One of the roles that MCAs play is to provide a space where members can learn about and discuss topics related to social identities. Only 30% of participants agreed that being a part of their MCA expanded their knowledge about their own identity, whereas over 55% said that the MCA constructively raises awareness of the challenges they face as an identity group. Most participants, over 2/3rds said that the MCA provides a safe place for healthy discussion on topics related to the identity group. Finally, as a result of being a member of their MCA, over 40% of participants feel comfortable being their full, authentic selves at Mines. | 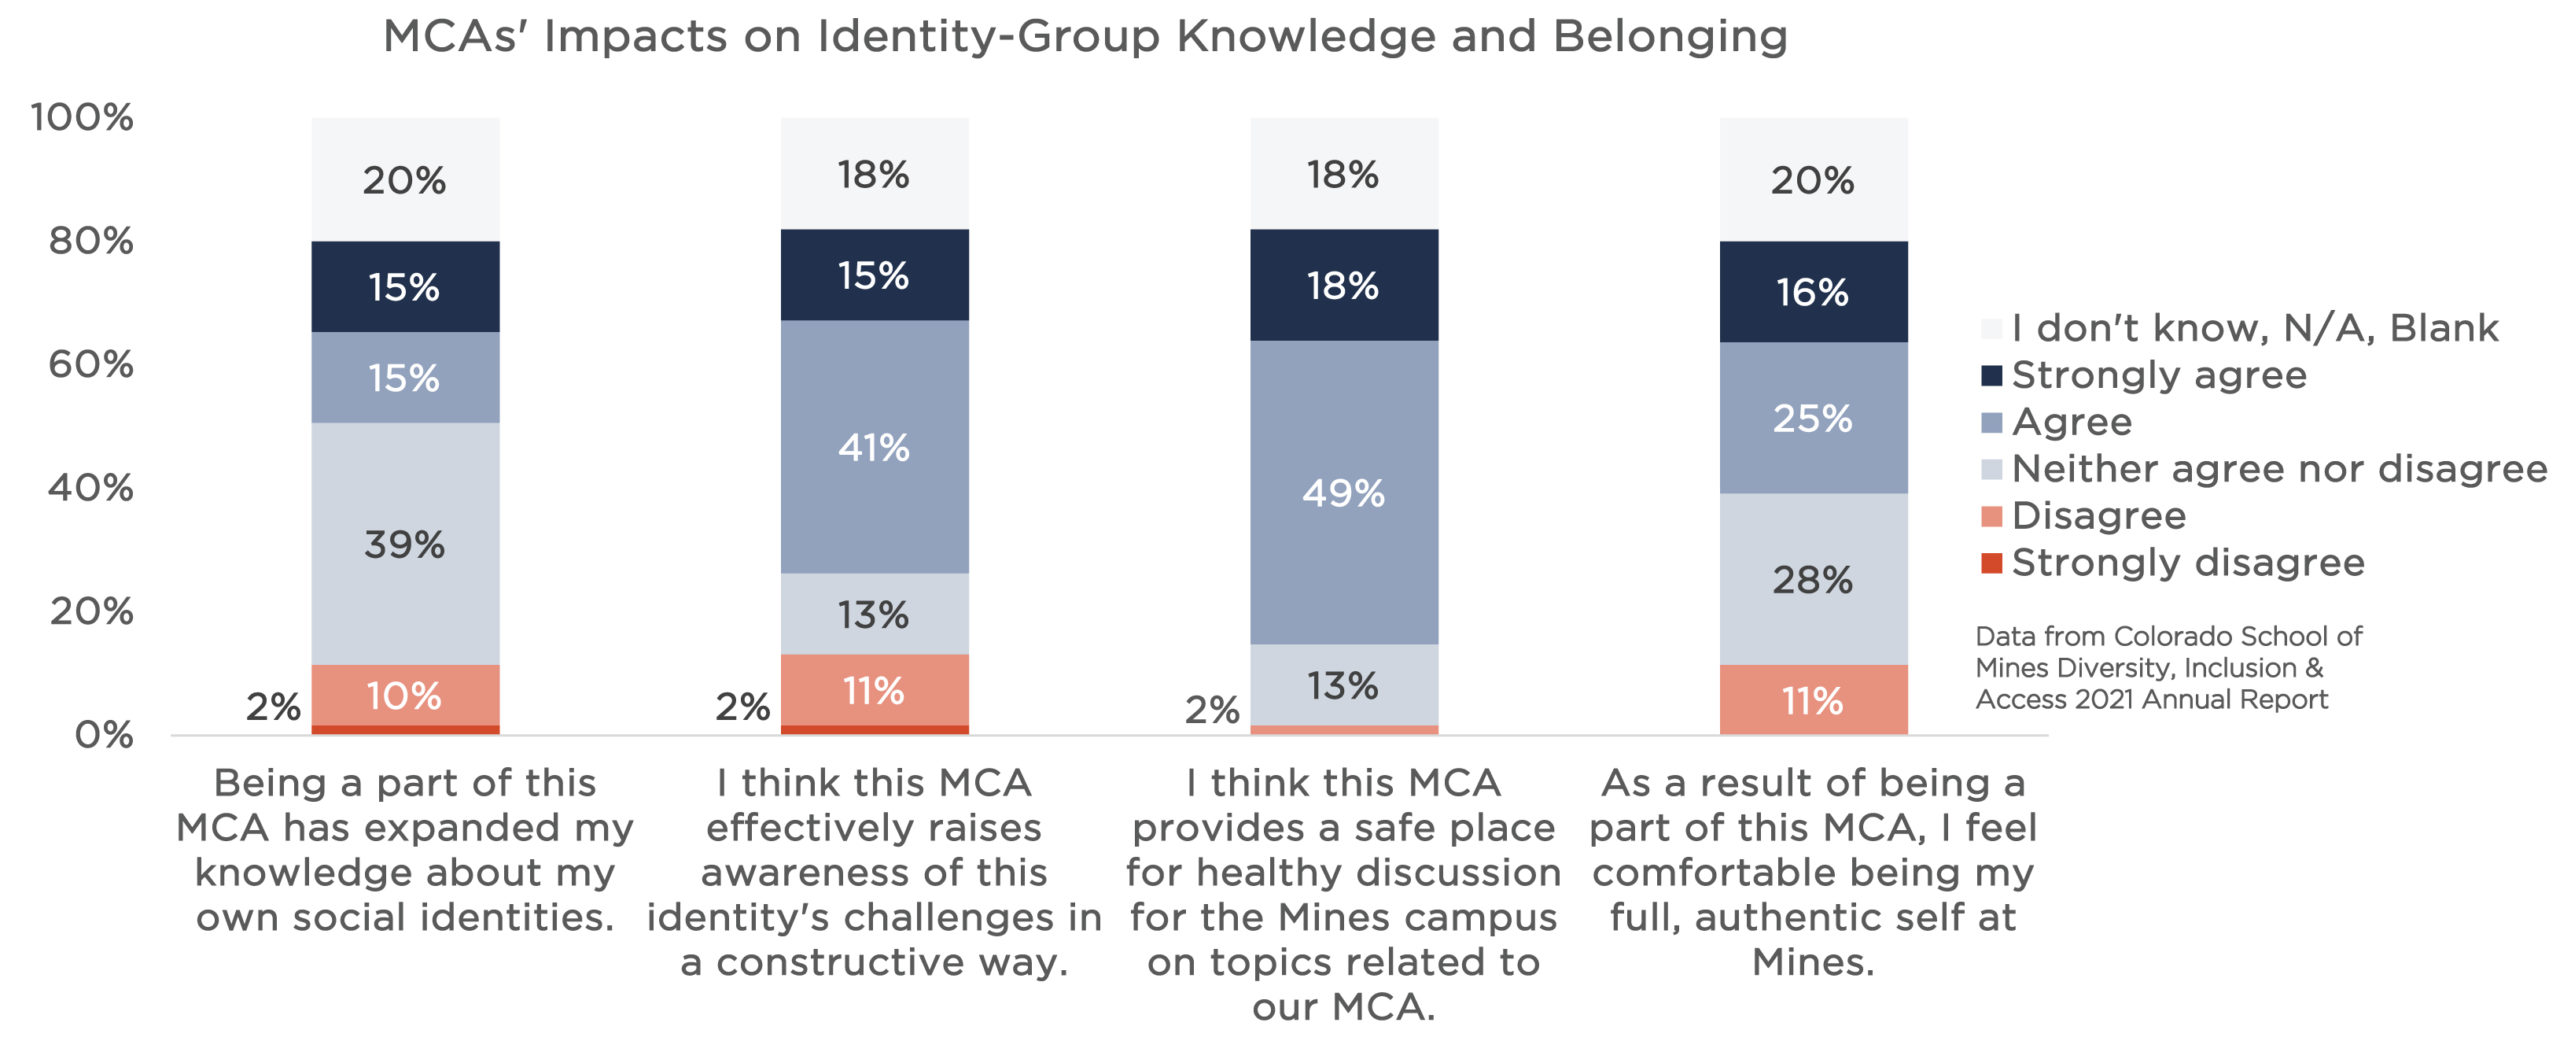 Click on graph image to view larger size Click on graph image to view larger size |
| Since MCA discussions often cover sensitive topics related to members’ identities, the evaluation survey asked a few questions about how safe members feel while engaging with the MCAs. Overall, over 65% of participants feel safe networking within the MCAs. This includes networking with members who identify with the MCA, members who are allies of that identity group and in general. These data suggest that overall, the MCAs feel safe for our members. | 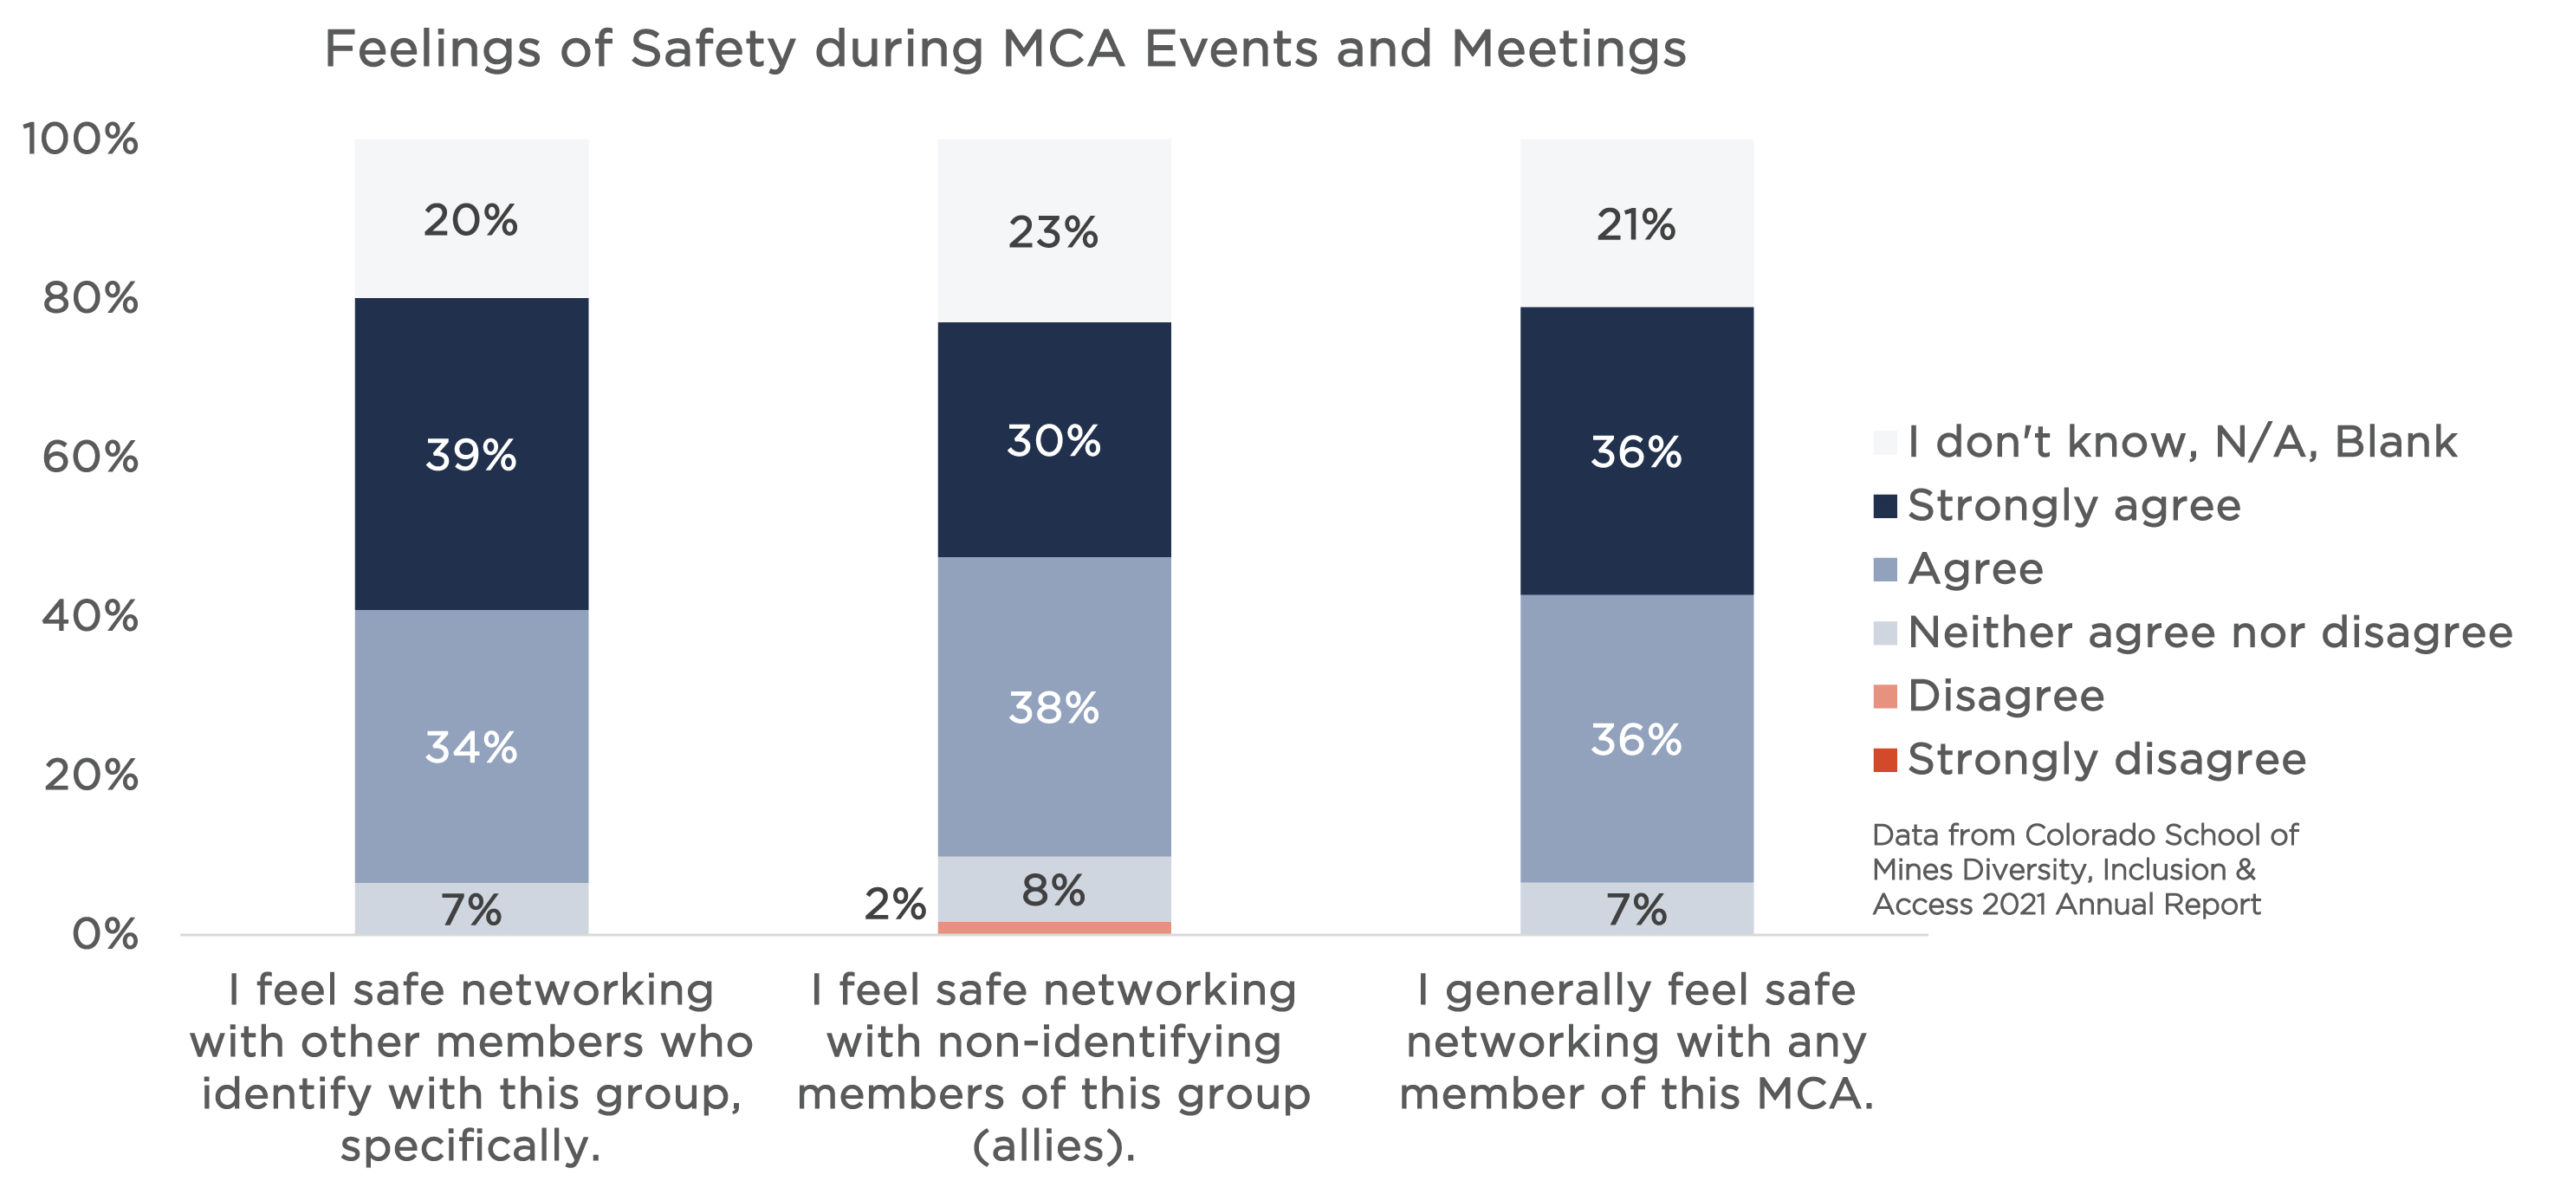 Click on graph image to view larger size Click on graph image to view larger size |
| One of the goals of the MCAs is to increase Mines’ outreach opportunities within the local community in Golden or Denver. Overall, 15% or fewer of survey respondents say they are not interested in participating in any outreach activities. | 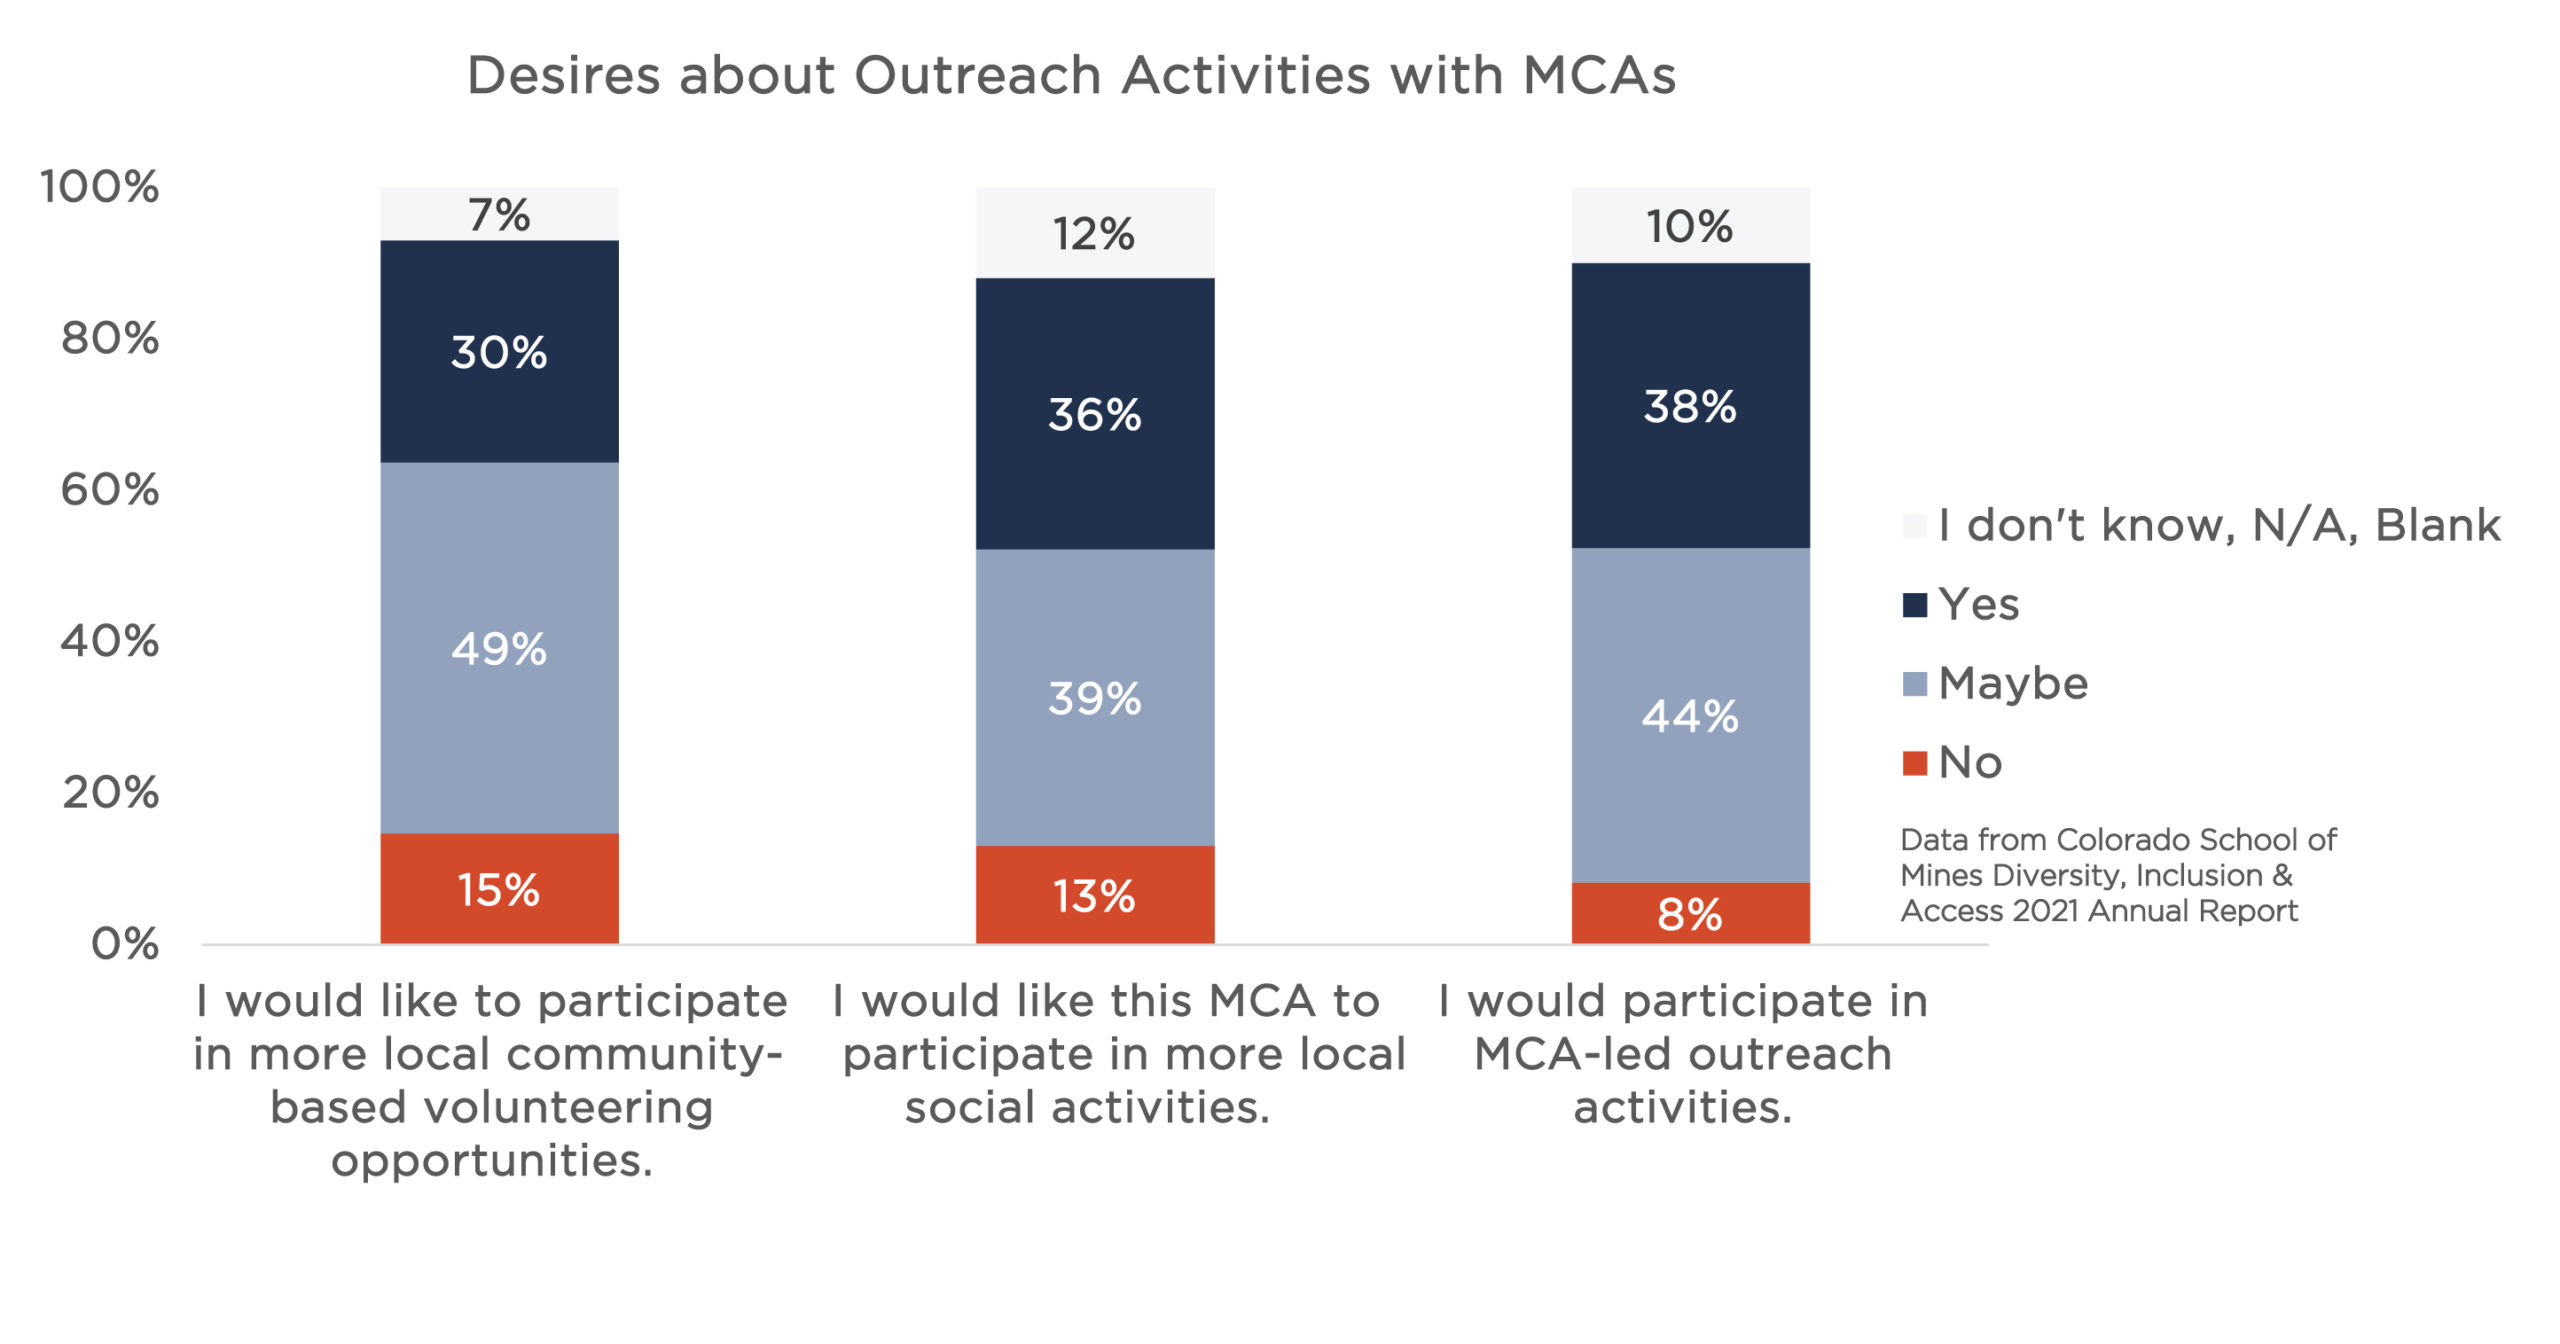 Click on graph image to view larger size Click on graph image to view larger size |