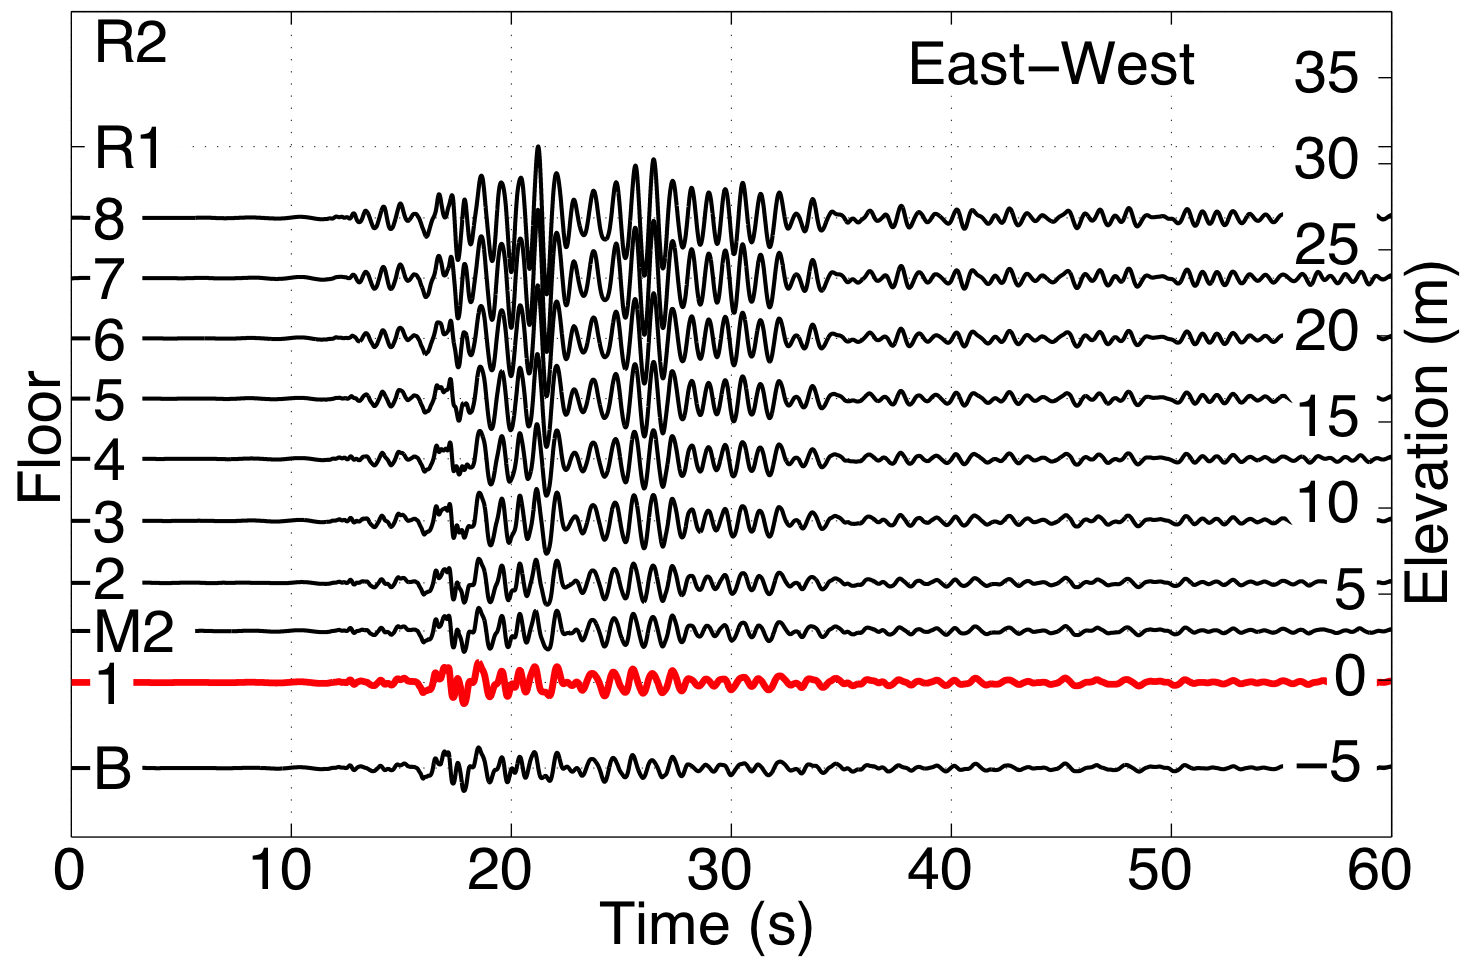
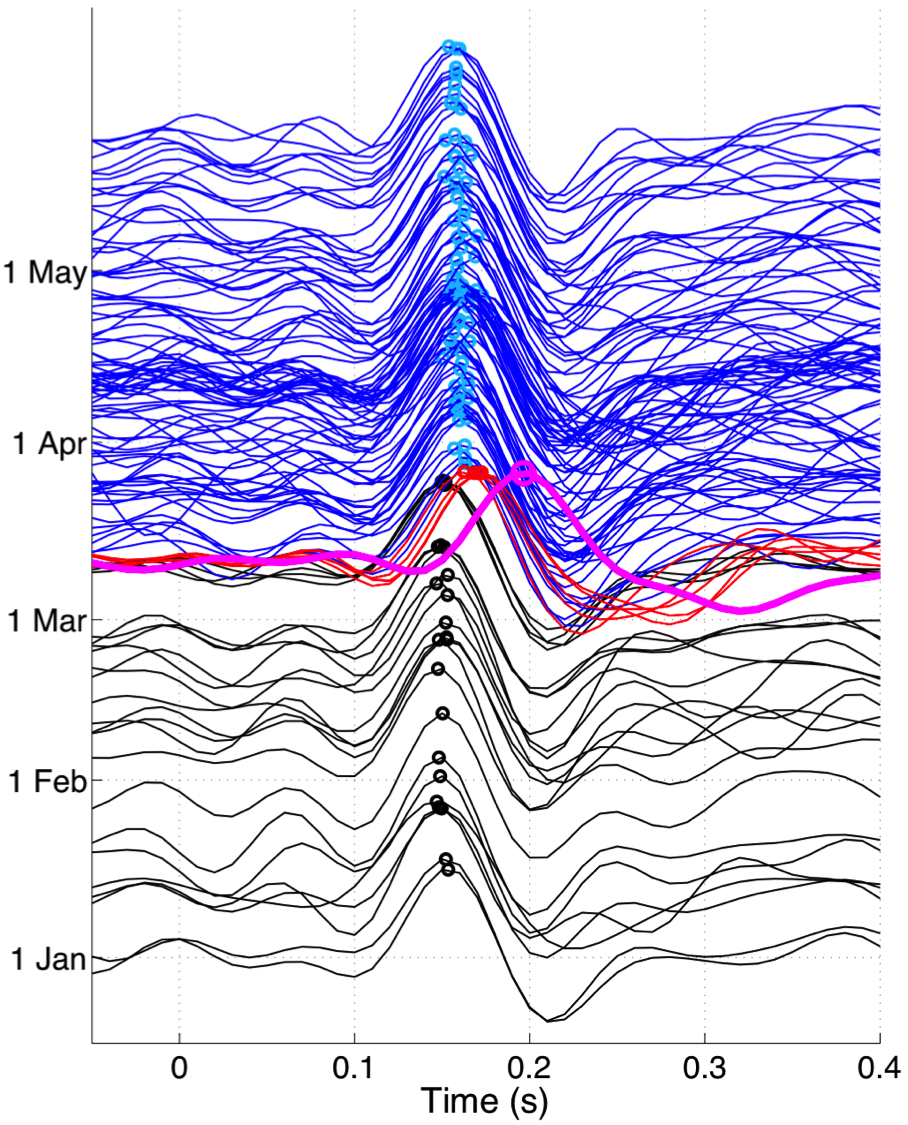
Vibrations in a building
depend on the following three factors: (1) the excitation
of the building at its base, (2) the coupling f the
building to the ground, and (3) the mechanical properties
of the building. All of these are unknown, and the left
panel shows the motion recorded at different levels of a
building in Japan. The waveforms on the left are not easy
to interpret. We developed a
technique to unscramble the scrambled eggs and
retrieve the building response to an impulsive loading.
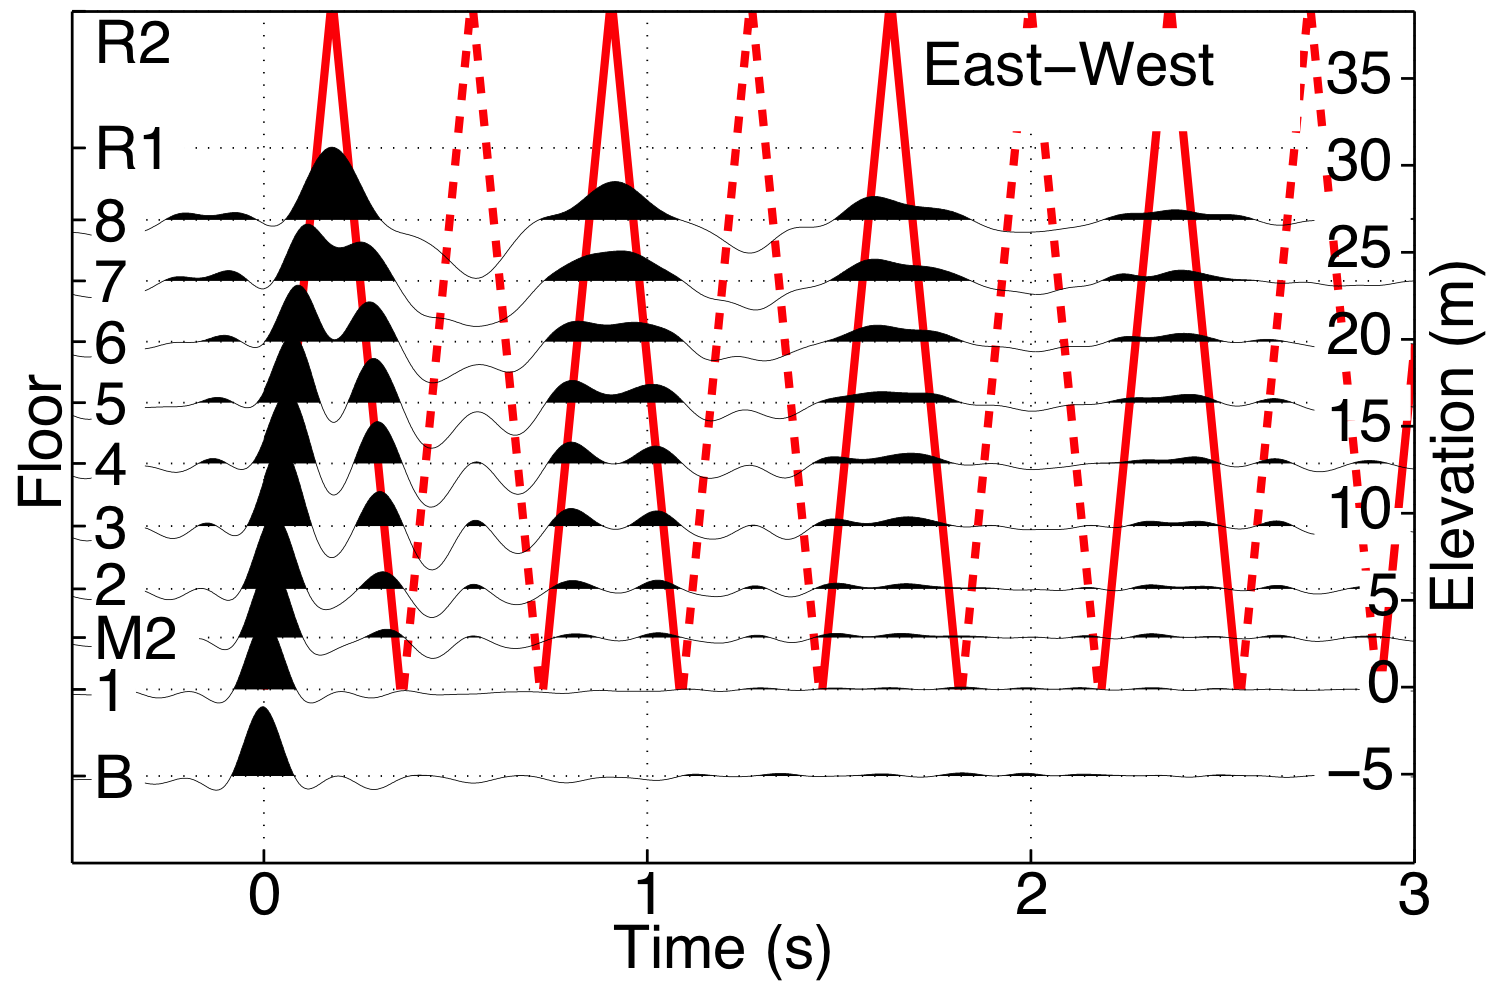
The figure on the right, from work of Nori Nakata
shows the waveforms after deconvolution with the waves
recorded at the first floor. The wavefield thus obtained
consists of wave that bounce up and down between the top
of the building and the first floor. Note that the waves
change polarity at every reflection at the first floor;
the reflection coefficient is equal to -1. One can show
that such deconvolved wave fields satisfy other boundary
conditions than the real building does.
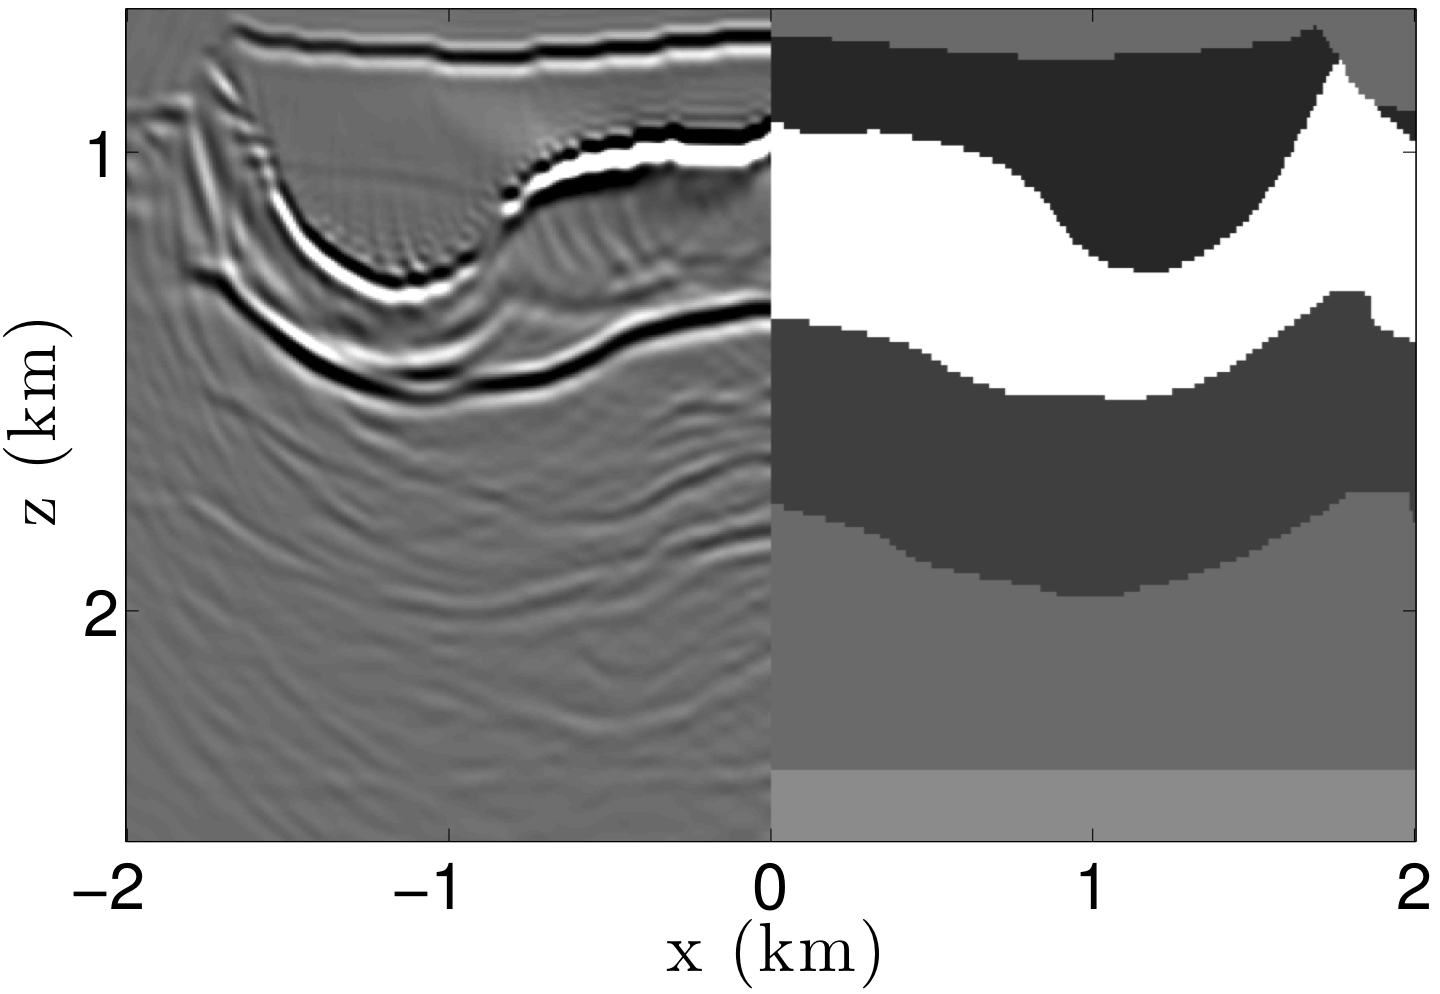
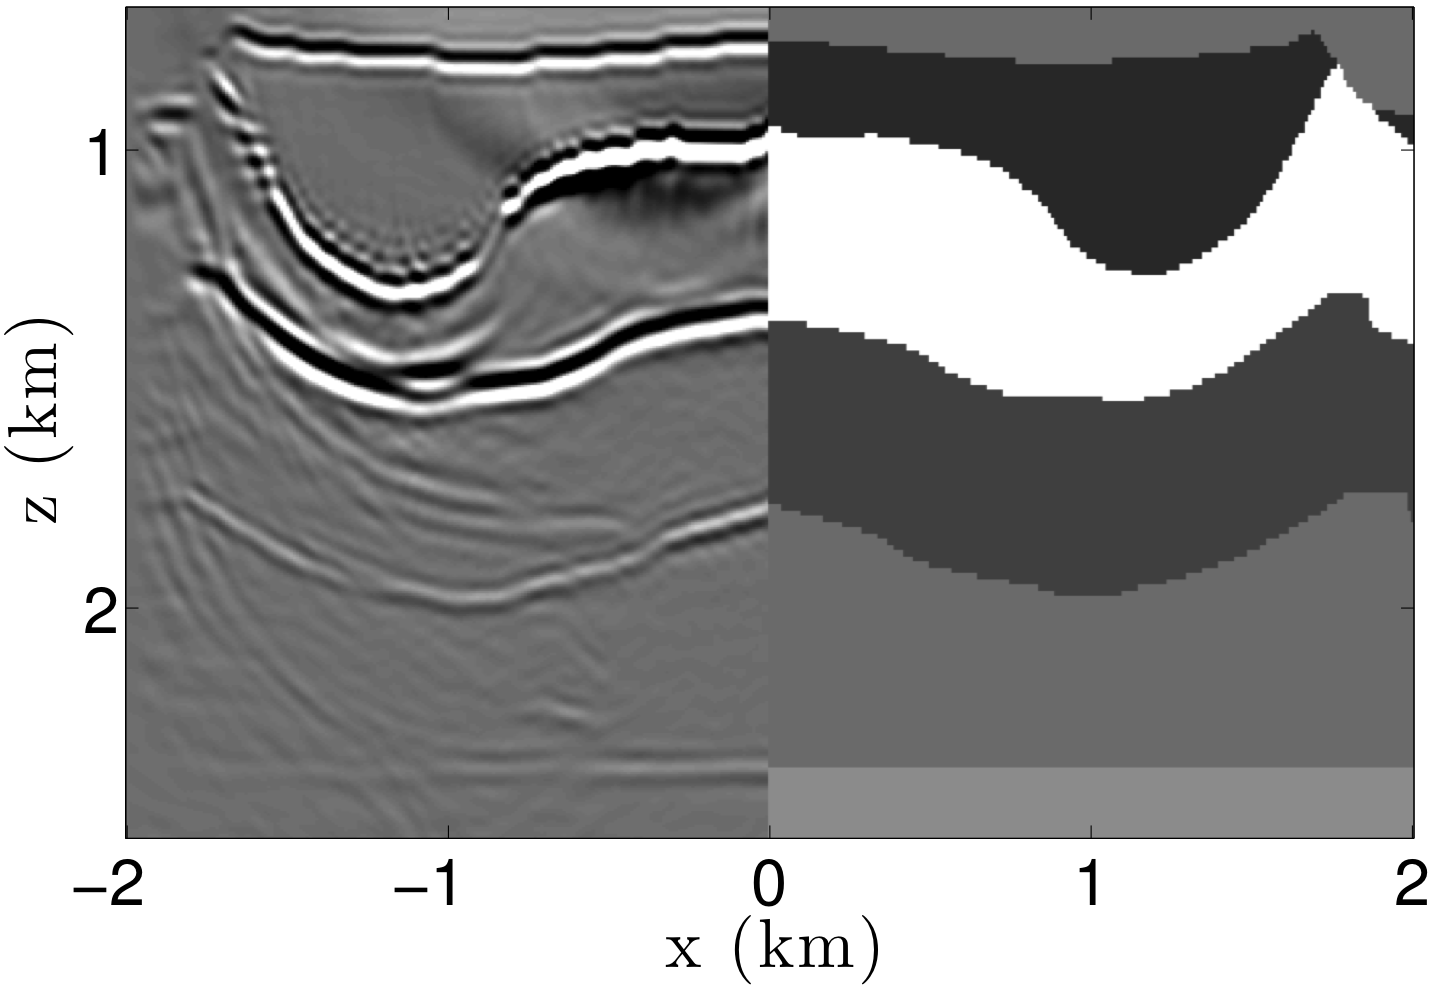
Can one form an image through
frosted glass without knowing the properties of the glass?
This appears to be impossible, but techniques originally
developed in quantum mechanics, called inverse scattering,
make it possible to do so. Key principle is that the function
that one solves for constructing the image is the function
that tell us how the waves propagate through the unknown
medium and focus on the imaging. This
principle is explained by Filippo Broggini. The right
half of the figures above give a model in which we seek to
find the reflectors. The left panel is for Reverse Time
Migration, the Cadillac of seismic imaging. The image contains
much reflections that should not be there. The image obtained
by the new technique of Marchenko
imaging, shown in the right, correlates much better with
the true interfaces. Note especially that the deep horizontal
reflector near the bottom is much better reconstructed. We do
this work in close collaboration with Kees
Wapenaar and his co-workers at Delft University of
Technology.
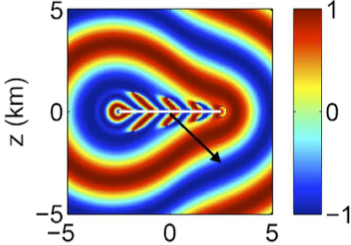
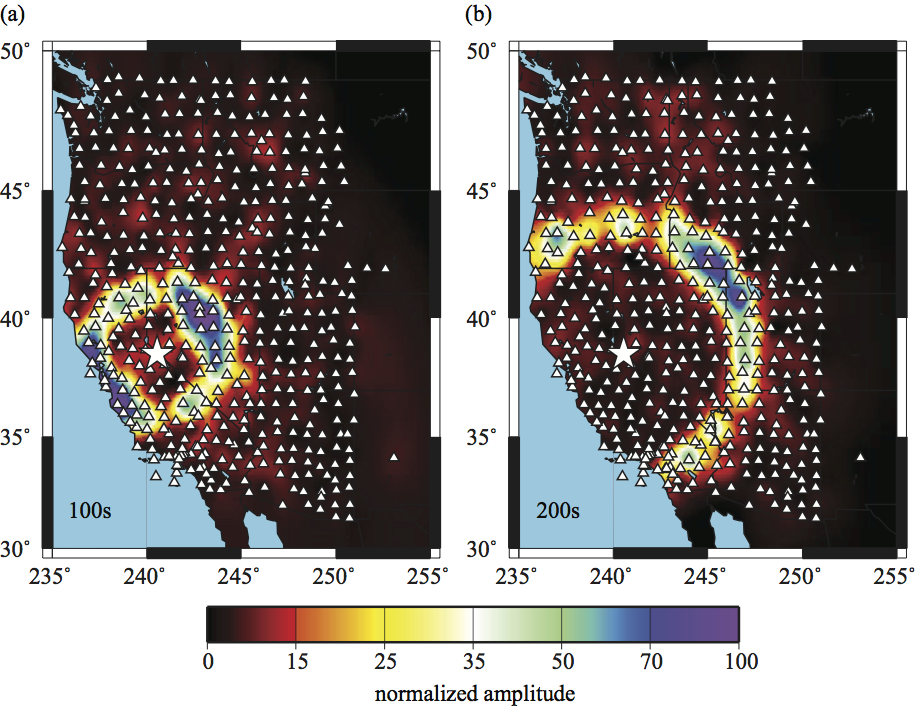
In many
applications one seeks to focus waves. Focusing one of the
ways in which one can study the source of waves, but one may
also focus waves as part of an imaging algorithm, or because
one seeks to modify a medium with focused waves (e.g.
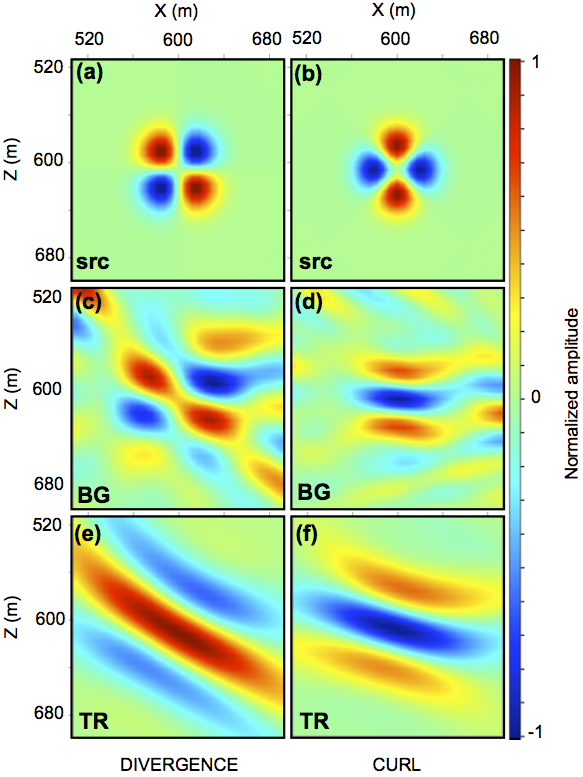
lithotripsy of kidney stones). The top panels above show the
image for P and S-waves for a moment tensor when the array
aperture is perfect. When the array used for the focusing in
sparse and incomplete, which is usually the case in the
earth, focusing can be a challenge, this is shown in the
bottom panels for the commonly used technique of
time-reversal imaging. Farhad Bazargani develop a method
that translates recorded
waves into new waveforms that are optimal for imaging.
The image of the source reconstructed with this waves is
shown in the middle panel. Although the image thus obtained
is far from the image in the top panel, it is a big
improvement over the images from time reversal imaging.