Tiny Feet Climate Action Planning Toolkit
Overview
The Tiny Feet Climate Action Plan (CAP) Toolkit Project is a cross-university collaboration between Colorado School of Mines and Western Colorado University. The team set out with the goal of creating a free working web application to help communities in Colorado to kickstart their Climate Action Planning Process by providing a start to an emissions inventory. Communities in Colorado will be able to query the emissions estimation for different regions in Colorado from the county level to the zip code level.
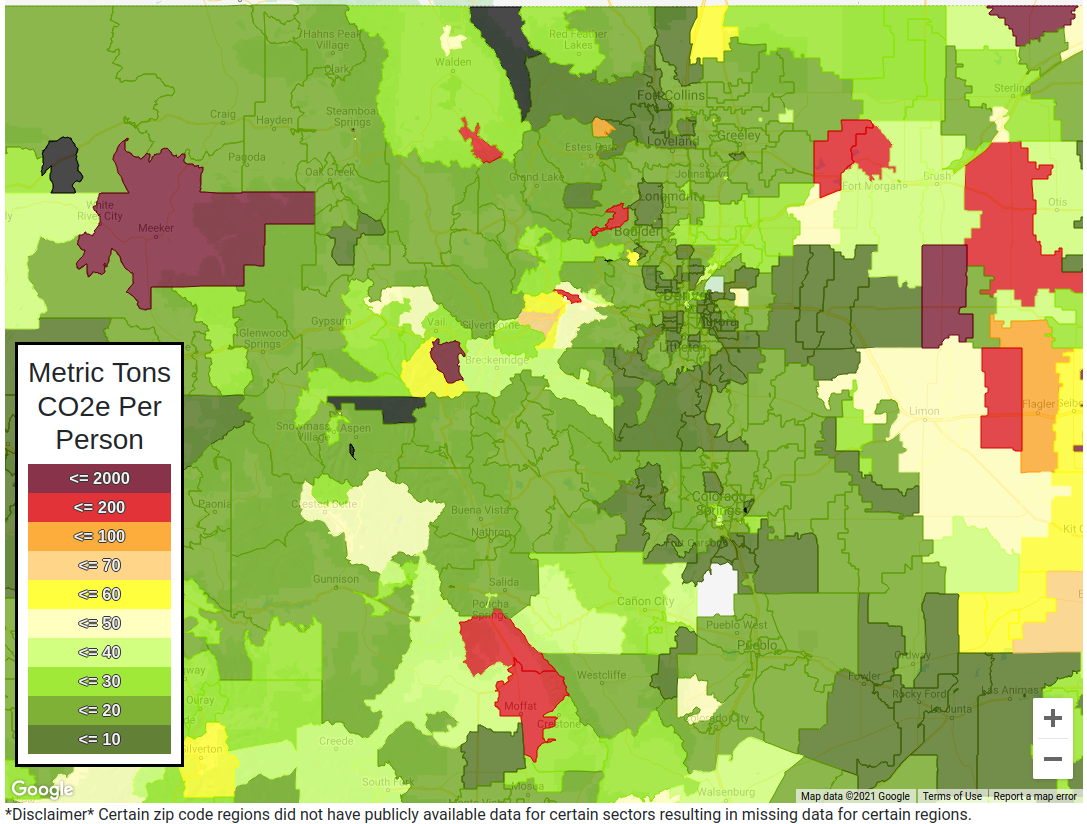
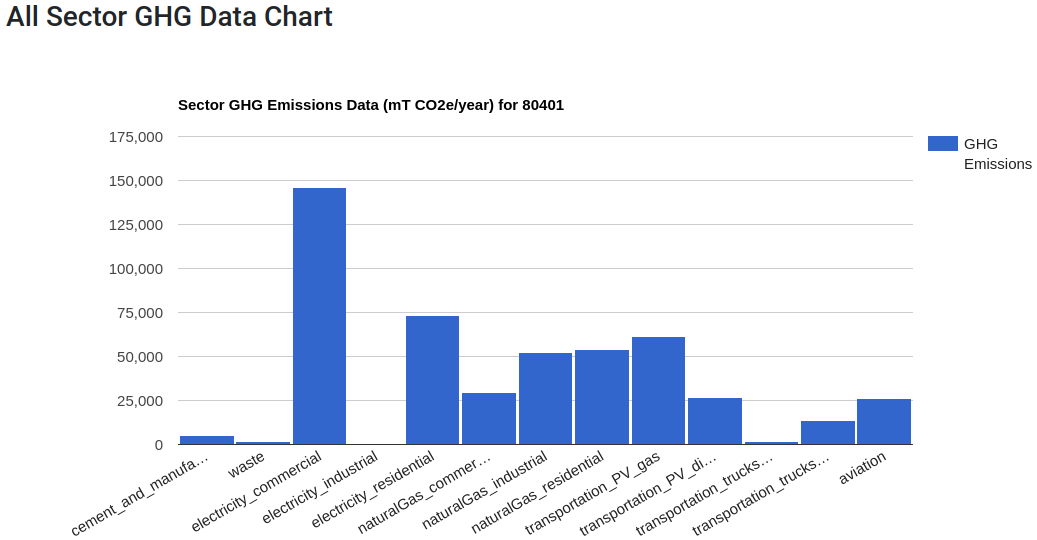
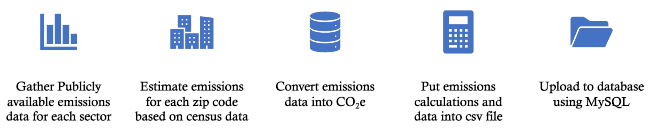
By using publicly available data, the team was able to create a no cost toolkit for communities to use. The emissions data will be displayed via a variety of graphical tools including a heat map and chart tables. The user is also able to compare multiple regions and download data for either a specific region or for an emissions sector for the entire state. As a secondary part of the web application, recommendations and possible solutions are displayed to help the kickstarting process. The user can filter these recommendations based on the emissions sector they want to target or by co-benefits for their community.

Live Zoom Chat
Use the link below to join us live from 8:00 – 10:30 a.m. on April 29.
Please use passcode: 079693
Or iPhone one-tap: 12532158782,97502755272# or 13462487799,97502755272#
Or Telephone:
Dial: +1 253 215 8782 (US Toll) or +1 346 248 7799 (US Toll)
Meeting ID: 975 0275 5272
Team Members
Colorado School of Mines Team: The 30 Percent
- Caroline Hidalgo
- Heather Keniry
- April Lyndon
- Perla Lyon
- Gillian Yost
- Kathie Zhang
Western Colorado University:
- Eric Swanson
The Client
- Western Colorado University
- Valeda Scribner
Acknowledgements
Project Advisors: Dr. Alina Handorean, Dr. Elizabeth Reddy
Technical Advisor: Prof. Amelia Read
Funding provided by: Western Colorado University Haley Fund
Video
Elevator Pitch
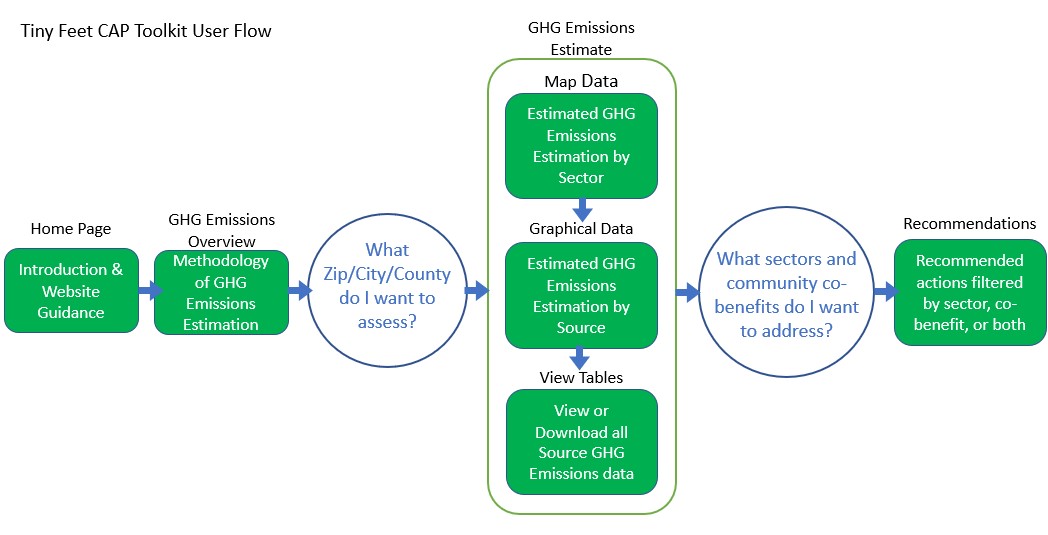
The Tiny Feet solve the accessibility problem by decreasing the cost of a CAP for communities and municipalities in Colorado and eventually for the rest of the country. As CAPs are expensive projects, the toolkit creates a free resource for the communities and municipalities to access data on their GHG emissions based on an estimation from publicly available sources. The data is accessed via a web application that allows the communities to input their zip code, city, or county. The information is presented so that users without much prior knowledge of CAPs and GHG emissions can interact with the information.
After the user enters their region-specific ID, the toolkit displays their emissions. The user can filter the recommendations based on how the solution can affect GHG emissions and co-benefits such as equity, economic sustainability, local environmental quality, enhancing public health and safety, and building resilience. The recommendations can also be filtered based on the sectors of focus. The web app will display the emissions level of the municipality and display suggested solutions.
Design Approach
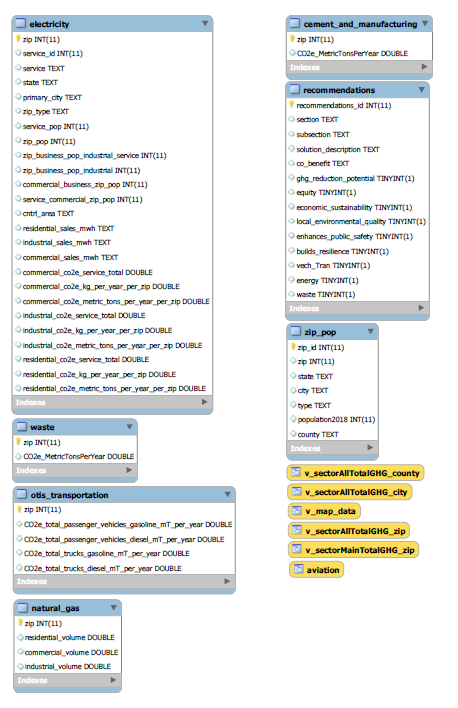
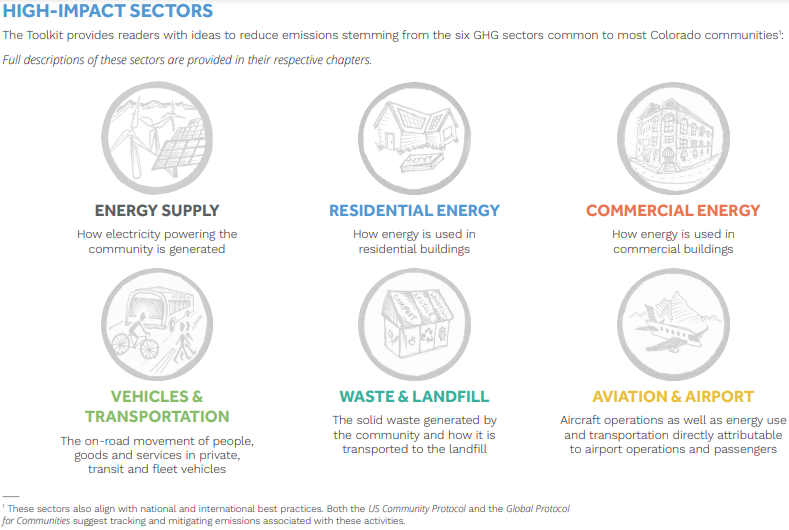
To fully address the problem at hand, the 30% Team began by calculating and developing accurate data for each of the defined emissions sectors. While each member worked on their respective sector, the team additionally developed a community survey, sent out at the beginning of the project to better understand what the stakeholders desired in an informational toolkit. The feedback survey primarily allowed the team to look forward to considering their preferences in the final design for the site. Following the finalization of the emissions data, organized in Microsoft excel and calculated into Co2e metric tons annually, the team then uploaded the data to be presented in terms of zeros and queried ones in MySQL, a database management program. Before designing the backend coding for each page of the site, the team met with Amelia Reed, the team’s academic advisor, and received advice on starting points to look at before writing the backend code and developing the database. During the design process, the team worked to create the best possible web application. As new features were added to the web app, the team worked together to make the features come to life.
Additionally, the team changed the basis of specific components to meets the needs discovered further down the design process. For example, the web application host had to change as the team decided to change the coding language for the web application. Though it was a minor change in the overall project, the final product had changed from the initial proposed solution as the team realized better methods in creating the final web application. Finally, to ensure the final product was the best possible product for our goal, a survey was sent out to one of our main stakeholders, Colorado communities, asking about their wants and needs for the project. By contacting the stakeholder, the team ensures the final product will include features the users want and not just want the team believes the users want. By communicating with the stakeholders and exploring various features along the design process, the team was able to design and create a toolkit meeting the expectation of the team.
Design Solution
To fully address the problem at hand, the 30% Team began by calculating and developing accurate data for each of the defined emissions sectors. While each member worked on their respective sector, the team additionally developed a community survey, shown in the appendices, sent out at the beginning of the project to better understand what the stakeholders desired in an informational toolkit. The feedback survey primarily allowed the team to look forward to considering their preferences in the final design for the site. Overall, the survey resulted in three responses that all indicated stakeholders’ preferences in what visuals they would like to see their emission data displayed. Two of the three suggested they would like to view their data in the form of a pie chart, which is now shown on the emissions page on the web application.
Following the finalization of the emissions data, organized in Microsoft excel and calculated into CO2e metric tons annually, the team then uploaded the data to be presented in terms of zeros and queried ones in MySQL, a database management program. Before designing the backend coding for each page of the site, the team met with Professor Amelia Read, the team’s academic advisor, and received advice on starting points to look at before writing the backend code and developing the database. Amelia began by guiding us towards calculating our database’s anticipated size to create future ease for the team in moving our data from Excel to MySQL. Once we understood the database’s size, we were then prompted to begin writing pseudo-code for the base website controls. Amelia’s suggestion catalyzed our learning process for website development and gave us key tips that allowed us to have a significant starting place.
Following the advice given by Professor Read, the 30% team broke up into technical and solutions teams. The technical team was Gillian Yost, Heather Keniry, and April Lyndon. The solutions and general content team were comprised of Perla Lyon, Kathie Zhang, and Caroline Hidalgo. The technical team moved forward in writing the framework for each page of the website and translating the list of solutions, broken down into co-benefits described earlier, into an excel page. If the solution fit certain co-benefits, a one was filled under that co-benefit column. Otherwise, a zero was filled in under that spot. This design within Excel allowed for an easier transition for the data into MySQL to be uploaded into the solutions page on the website. Uploading correct data involves communication and coordination between the technical and solutions page teams.
During the design process, the team worked to create the best possible web application. As new features were added to the web app, the team worked together to make the features come to life. Even so, certain features suggested by the client had to be declined. Ascertain features were not necessary for the project to help kickstart their climate action planning process. The team had to decline in adding the features to complete other web applications for a functioning web application. Throughout the process, the team added necessary features and removed any unnecessary features that cannot be completed within the timeline.
Additionally, the team changed the basis of specific components to meets the needs discovered further down the design process. For example, the web application host had to change as the team decided to change the coding language for the web application. Though it was a minor change in the overall project, the final product had changed from the initial proposed solution as the team realized better methods in creating the final web application. Finally, to ensure the final product was the best possible product for our goal, a survey was sent out to one of our main stakeholders, Colorado communities, asking about their wants and needs for the project. By contacting the stakeholder, the team ensures the final product will include features the users want and not just want the team believes the users want. By communicating with the stakeholders and exploring various features along the design process, the team was able to design and create a toolkit meeting the expectation of the team.
The team’s solution consists of the final web application, and the version shown in the video will be demoed by joining our zoom call. The link below shows the final version by Eric Swanson for his Capstone project.
Next Steps
 Even though our project was successful, and we were able to attain the goals defined at the beginning of the project, there are many improvement opportunities. Moving forward, it will be essential to have future teams working on the database with members that have a computer science background for faster and more detailed results to inform communities. With such skills, the future team can be more successful with the project. Also, the database uses data from 2018, so in the future, it will be relevant to refine the database to update itself as newer emissions information becomes available. To make this process easier, having calculations done in the database rather than Microsoft Excel can be more effective, reducing the workload and automating the project.
Furthermore, it would be beneficial to refine the solutions displayed to be rated on their effectiveness, on a scale from one to five, so that municipalities can quickly check which solutions would be more important to implement. Another improvement would be to make the descriptions for the solution shorter, maintain user engaged and make the layout cleaner. In addition, making the normalization of data based on population density for the heat map would make the data more comprehensive. It would also be beneficial, including a pie chart in the chart data page so users can see a bar chart and a pie chart. These changes are helpful to convey the information to the user and more easily understand the data displayed.
Finally, from the beginning of the project, the dream was to expand the web application to other states besides Colorado. Even though this was not a goal for the 30 Percent, it could be a goal for future teams. As a result, it would bring the Tiny Feet project to reach municipalities nationally and rapidly create CAPs.
Meet the Team
Caroline Hidalgo
 Caroline Hidalgo is pursuing a degree in Electrical Engineering B.S. at Colorado School of Mines. Her emphasis area covered Antennas and Wireless Communications. She enjoys snowboarding, hiking, climbing, and drinking boba tea in her free time.
Heather Keniry
 Heather Keniry is studying Mechanical Engineering with a minor in Computer Science. She will be working as an intern for Skip-Line Inc. She enjoys running, hiking, and reading. Heather is originally from La Grande, Oregon.
April Lyndon
 April Lyndon is pursuing a degree in Mechanical Engineering and a minor in Economics at Colorado School of Mines.
Perla Lyon
 Perla Lyon is a senior Environmental Engineering student. She has work experience in various areas, including customer service and business. In her free time, she enjoys hiking, traveling, and camping. She is passionate about the outdoors, plants and is always looking for new challenges.
Gillian Yost
 Gillian Yost is currently a senior at Colorado School of Mines where she is majoring in Electrical Engineering with double minors in Computer Science and Public Affairs.
Kathie Zhang
 Kathie Zhang is pursuing a Mechanical Engineering B.S. at Colorado School of Mines. Outside of school, her favorite pastime is to get some boba (Tapioca Drink) with her friends.