This report has an abundance of data to show how Mines is progressing toward the DI&A Strategic Plan goals. The following data contain key highlights from the 2021 Annual Report website from each of the Strategic Plan’s Priority Focus Areas. These data will set the stage for understanding trends at Mines over time to help individuals, units and administrators make informed decisions about their DI&A efforts and policies. Our collective actions will help ensure all Orediggers feel welcome to be their full authentic selves at Mines.
• Recruitment Trends of Students and Employees •
Recruitment strategies steeped in diversity, equity and inclusion evidence-based practices are crucial for matching the demographics of the populations from which we draw talent. Mines began introducing new initiatives to improve recruitment in admissions, scholarship programming, financial aid and hiring of employees. The following data show the progress these efforts have made in 2021 for undergraduate and graduate students and for employees. The undergraduate and graduate recruitment pipelines show the total number of students who applied to Mines, were admitted to Mines, and who enrolled at Mines for the fall 2021 semester (x-axis). Each bar in the graph shows the proportion of these totals by student demographic. Employee data show the proportion of hires for faculty by demographic.
Undergraduate Recruitment Pipeline
| This graph represents the number and proportion of first-year and transfer undergraduate students who applied to Mines, were admitted into Mines and who enrolled at Mines for the fall of 2021. This “admissions pipeline” describes a big-picture story of admissions trends in 2021 by gender. Gender is defined here as only either male or female due to limitations in data collection and reporting. | 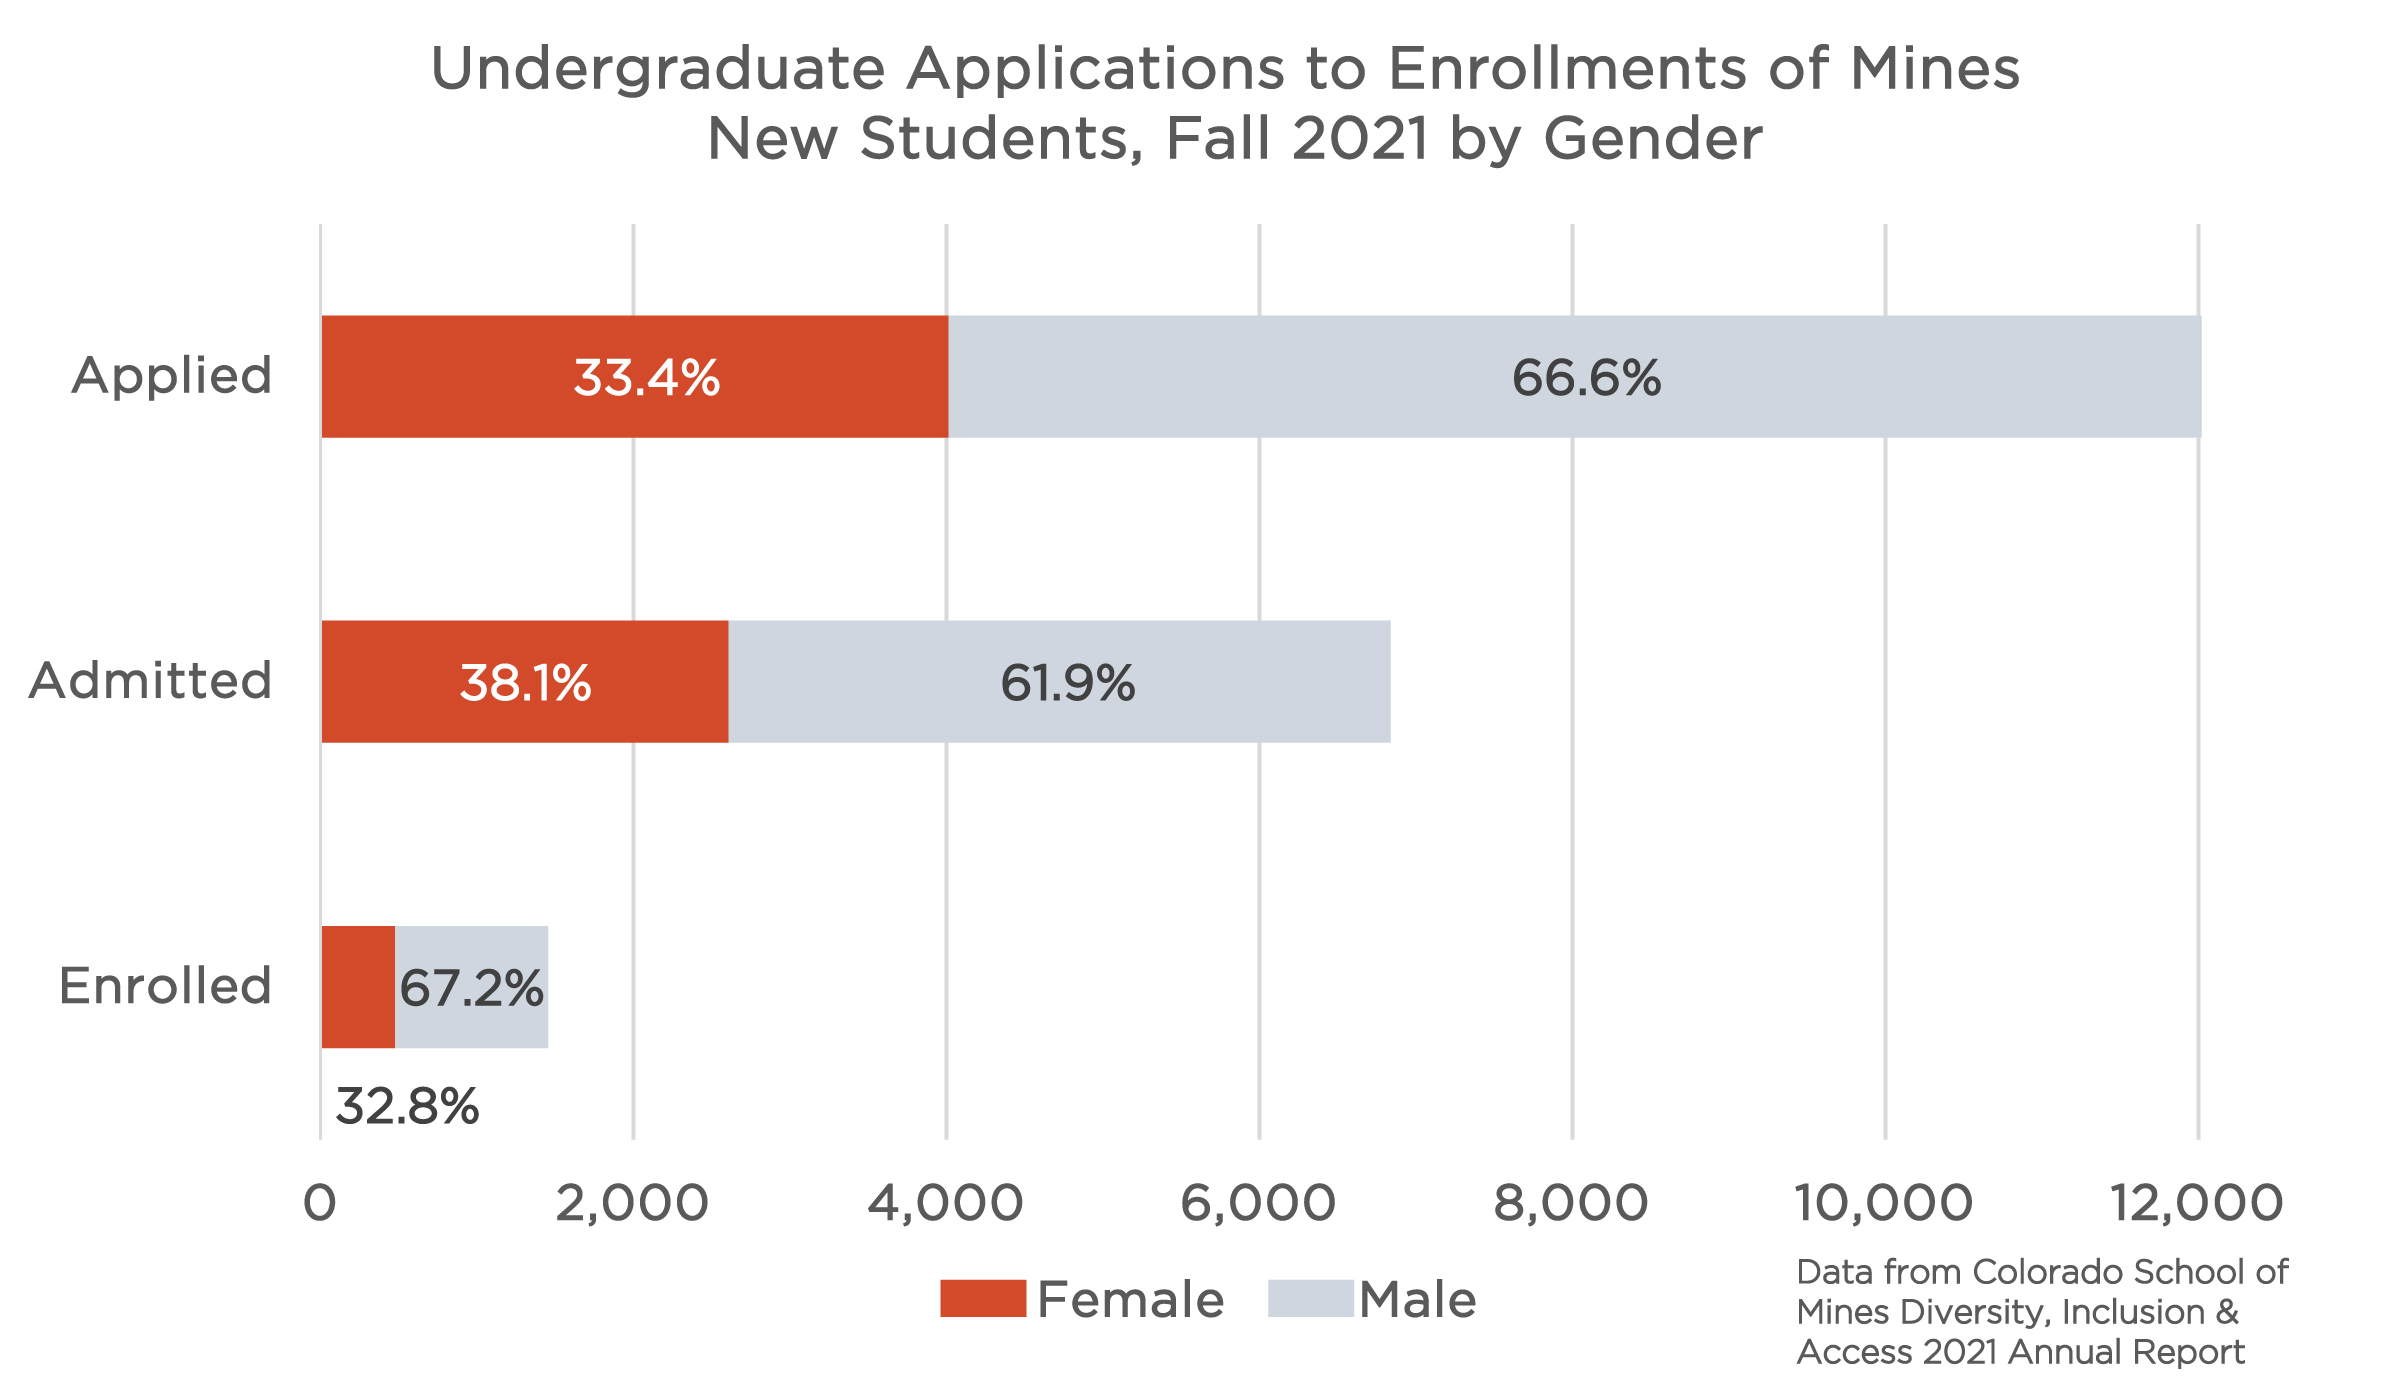 Click on graph image to view larger size Click on graph image to view larger size |
| Similar to the admissions pipeline showing the gender breakdowns of Mines incoming 2021 class, this graph shows the number and proportion of first-year and transfer undergraduate students by race and ethnicity. This admissions pipeline describes a big-picture story of admissions trends in 2021 by detailing the number and proportion of undergraduate students who applied to Mines, were admitted into Mines and who enrolled at Mines. We define URG as those who identify as American Indian/Alaskan Native, African American/Black, Asian, Hispanic/Latinx, multiple races and Native Hawaiian/Pacific Islander. | 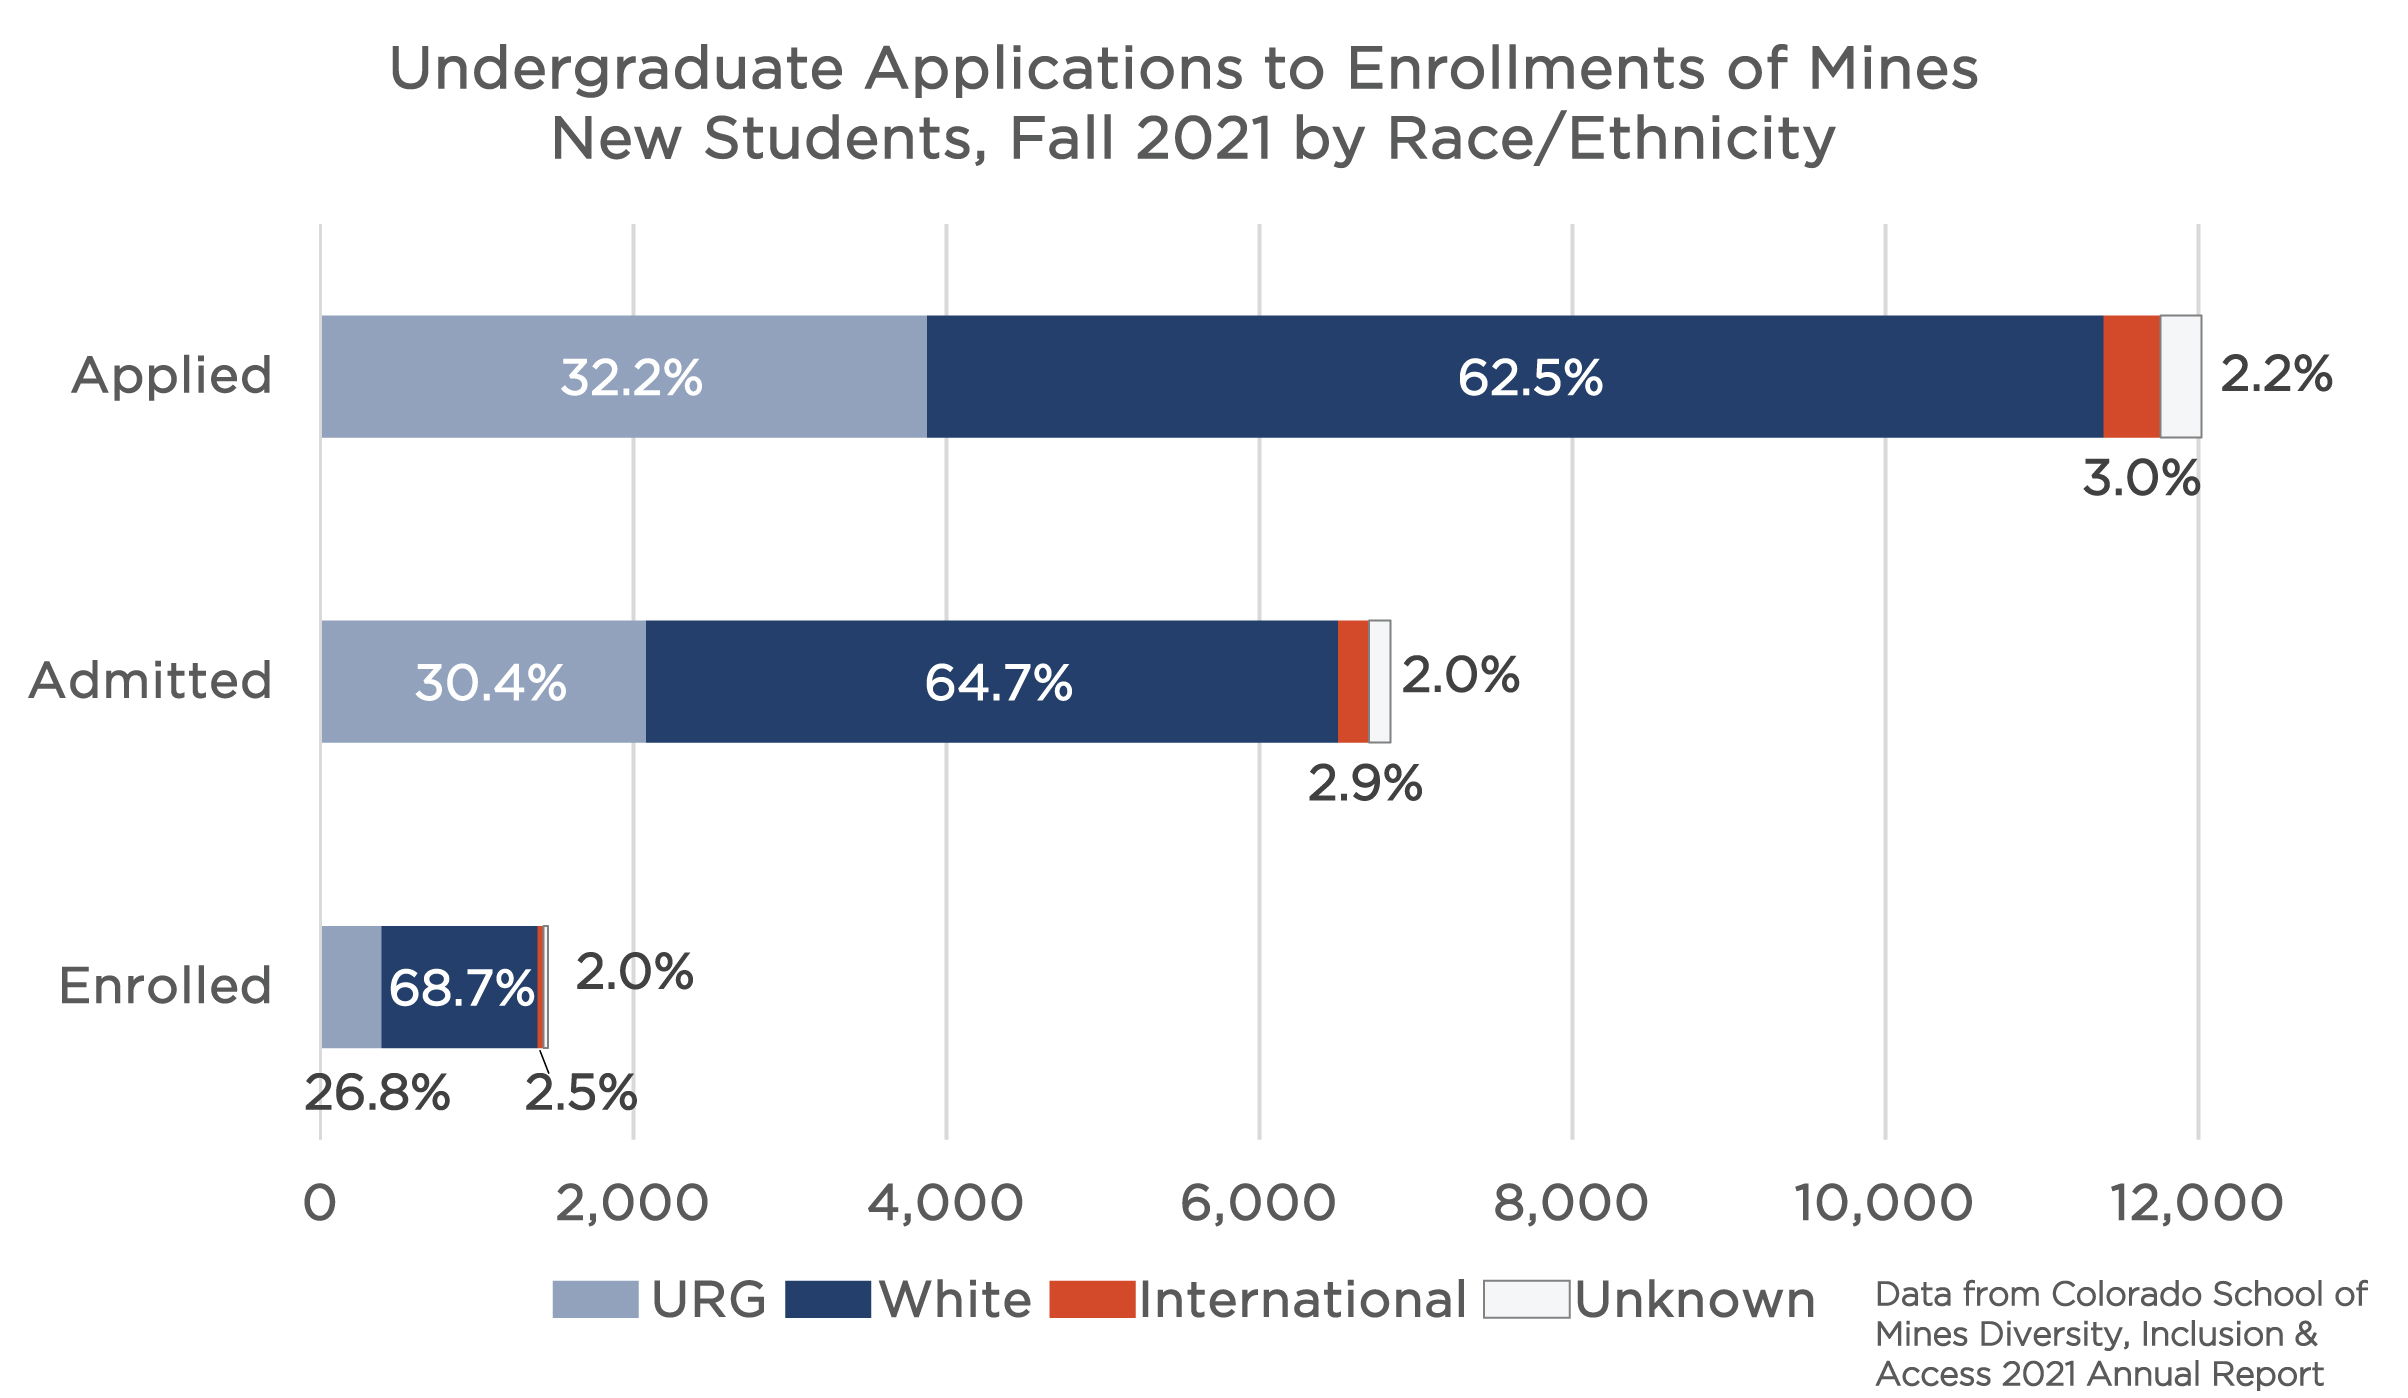 Click on graph image to view larger size Click on graph image to view larger size |
Graduate Recruitment Pipeline
| This graph shows the number of applicants, students admitted and students enrolled at Mines for thesis graduate programs, in fall 2021, broken down by gender. There are some notable differences between the proportion of female identifying students who applied, were admitted and who enrolled; we observe that proportionally more students were admitted and enrolled than the proportion who applied. This shows that we’re admitting and enrolling more female identifying graduate students in our thesis programs than the proportion who apply. Overall, there are still more male identifying students compared to female identifying students. These data include new, incoming thesis graduate students and includes both residential (in-person) and online programs. The data include all degrees, except “null.” Thesis programs include Master’s and Doctoral degrees. Gender is defined here as only either male or female due to limitations in data collection and reporting. | 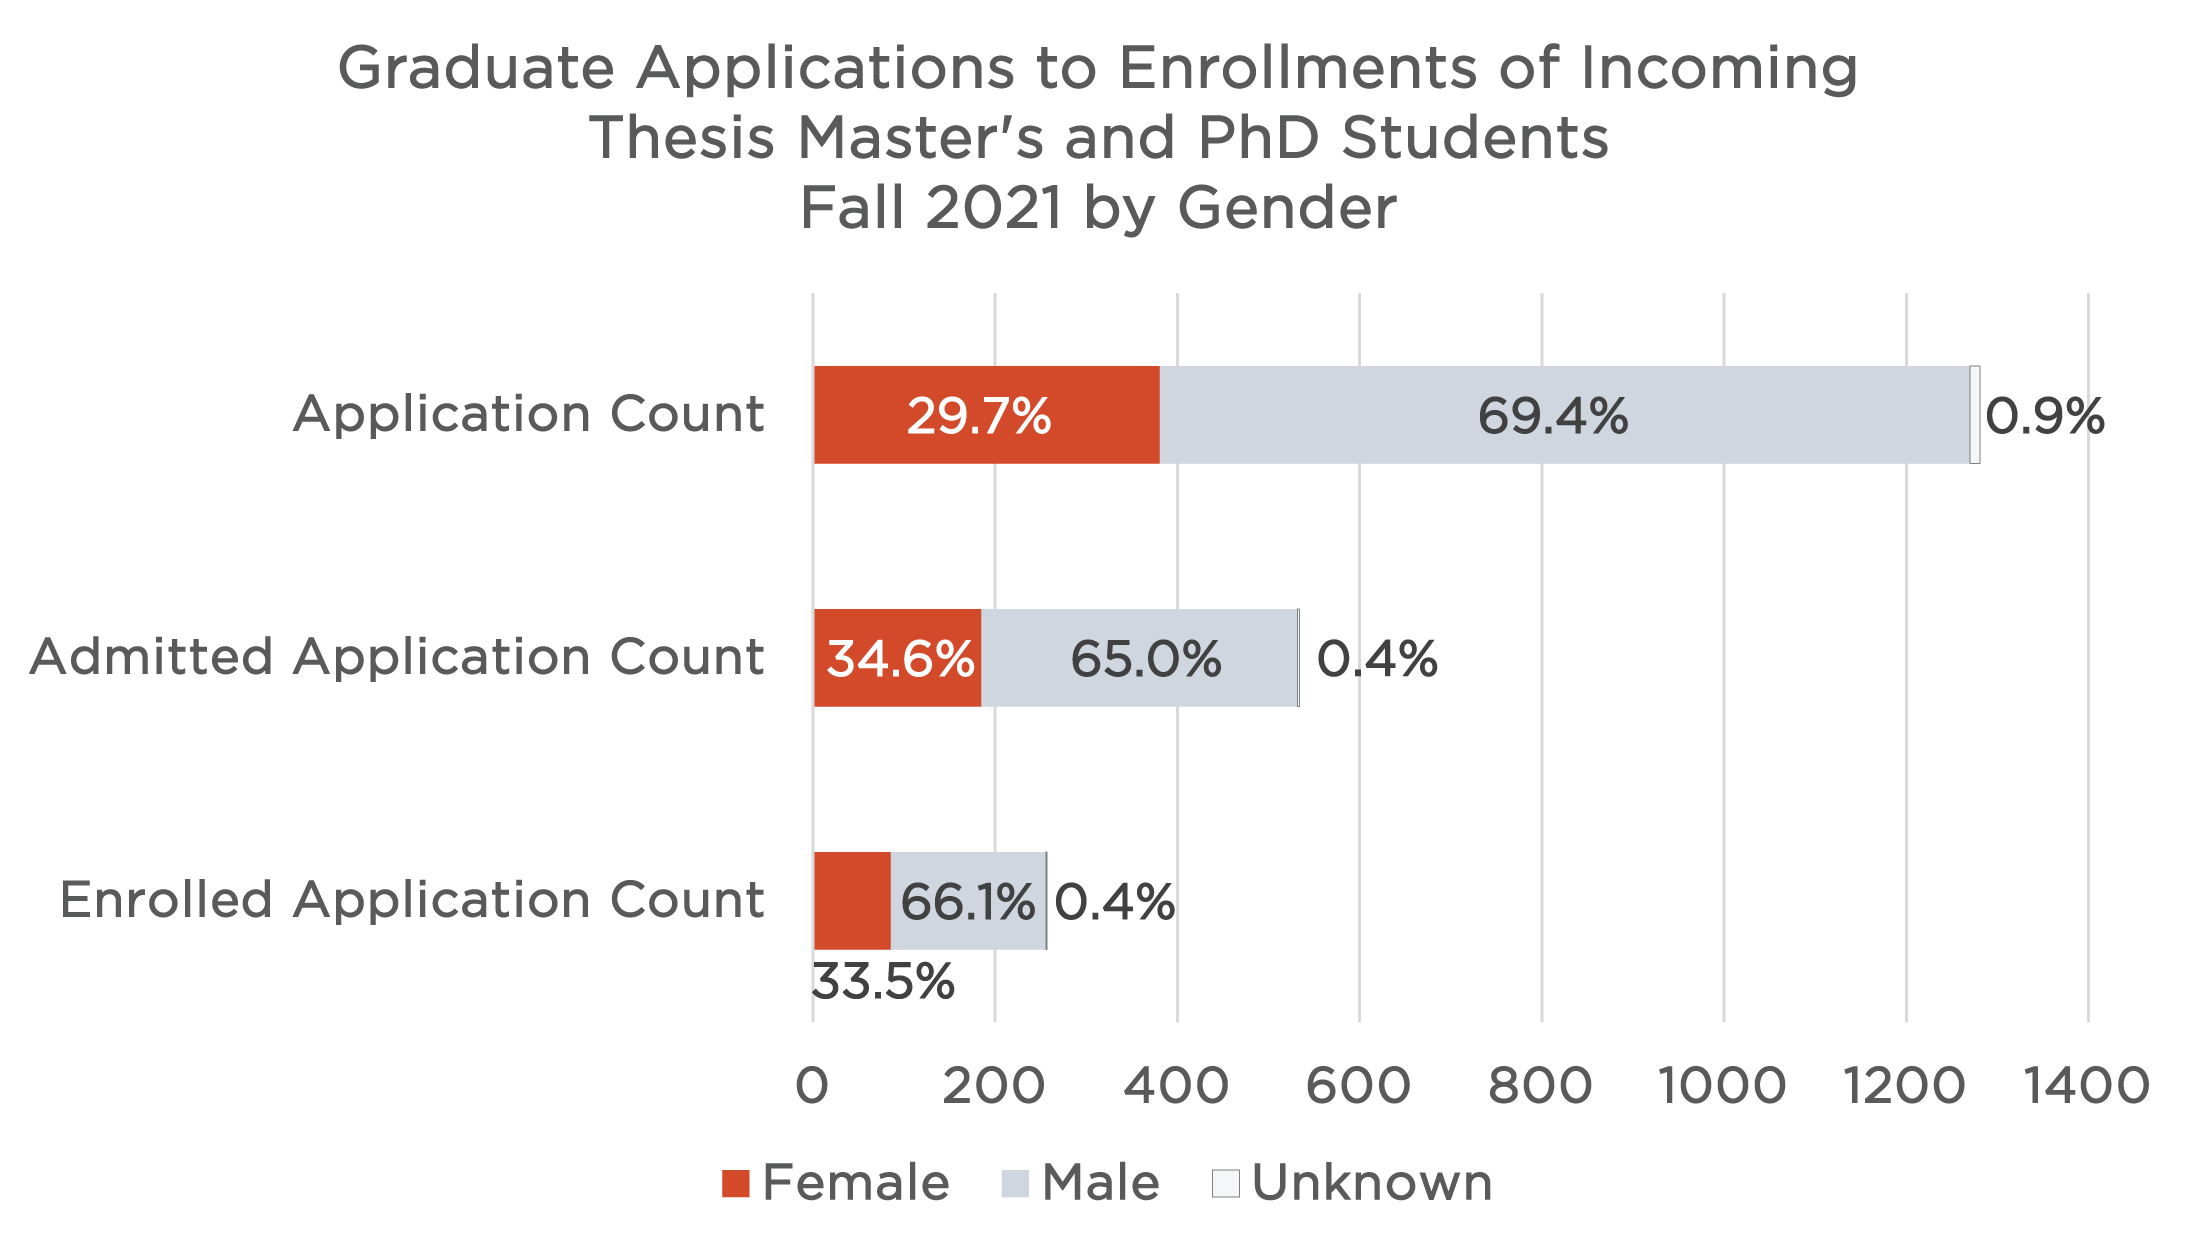 Click on graph image to view larger size Click on graph image to view larger size |
| This graph shows only the domestic students grouped by race and ethnicity. The United States has specific definitions and goals for diversity efforts, which typically include our marginalized populations of color excluding international populations here on a visa. Therefore, when we consider our MINES@150 goals for representation, we want to ensure that our US students are proportionally represented in our degree programs. Notice now the representation of our racial/ethnic marginalized populations proportionally increased substantially, as compared to when we included our international student population. However, these students apply at a considerably higher rate than they enroll at Mines, which is something to investigate further. One explanation could be higher financial aid awards from competing institutions. These data only include new, incoming thesis graduate students, and includes both residential (in-person) and online programs. The data include all degrees, except “null.” Thesis programs include Master’s and Doctoral degrees. We define URG as those who identify as American Indian/Alaskan Native, African American/Black, Asian, Hispanic/Latinx, multiple races, and Native Hawaiian/Pacific Islander. | 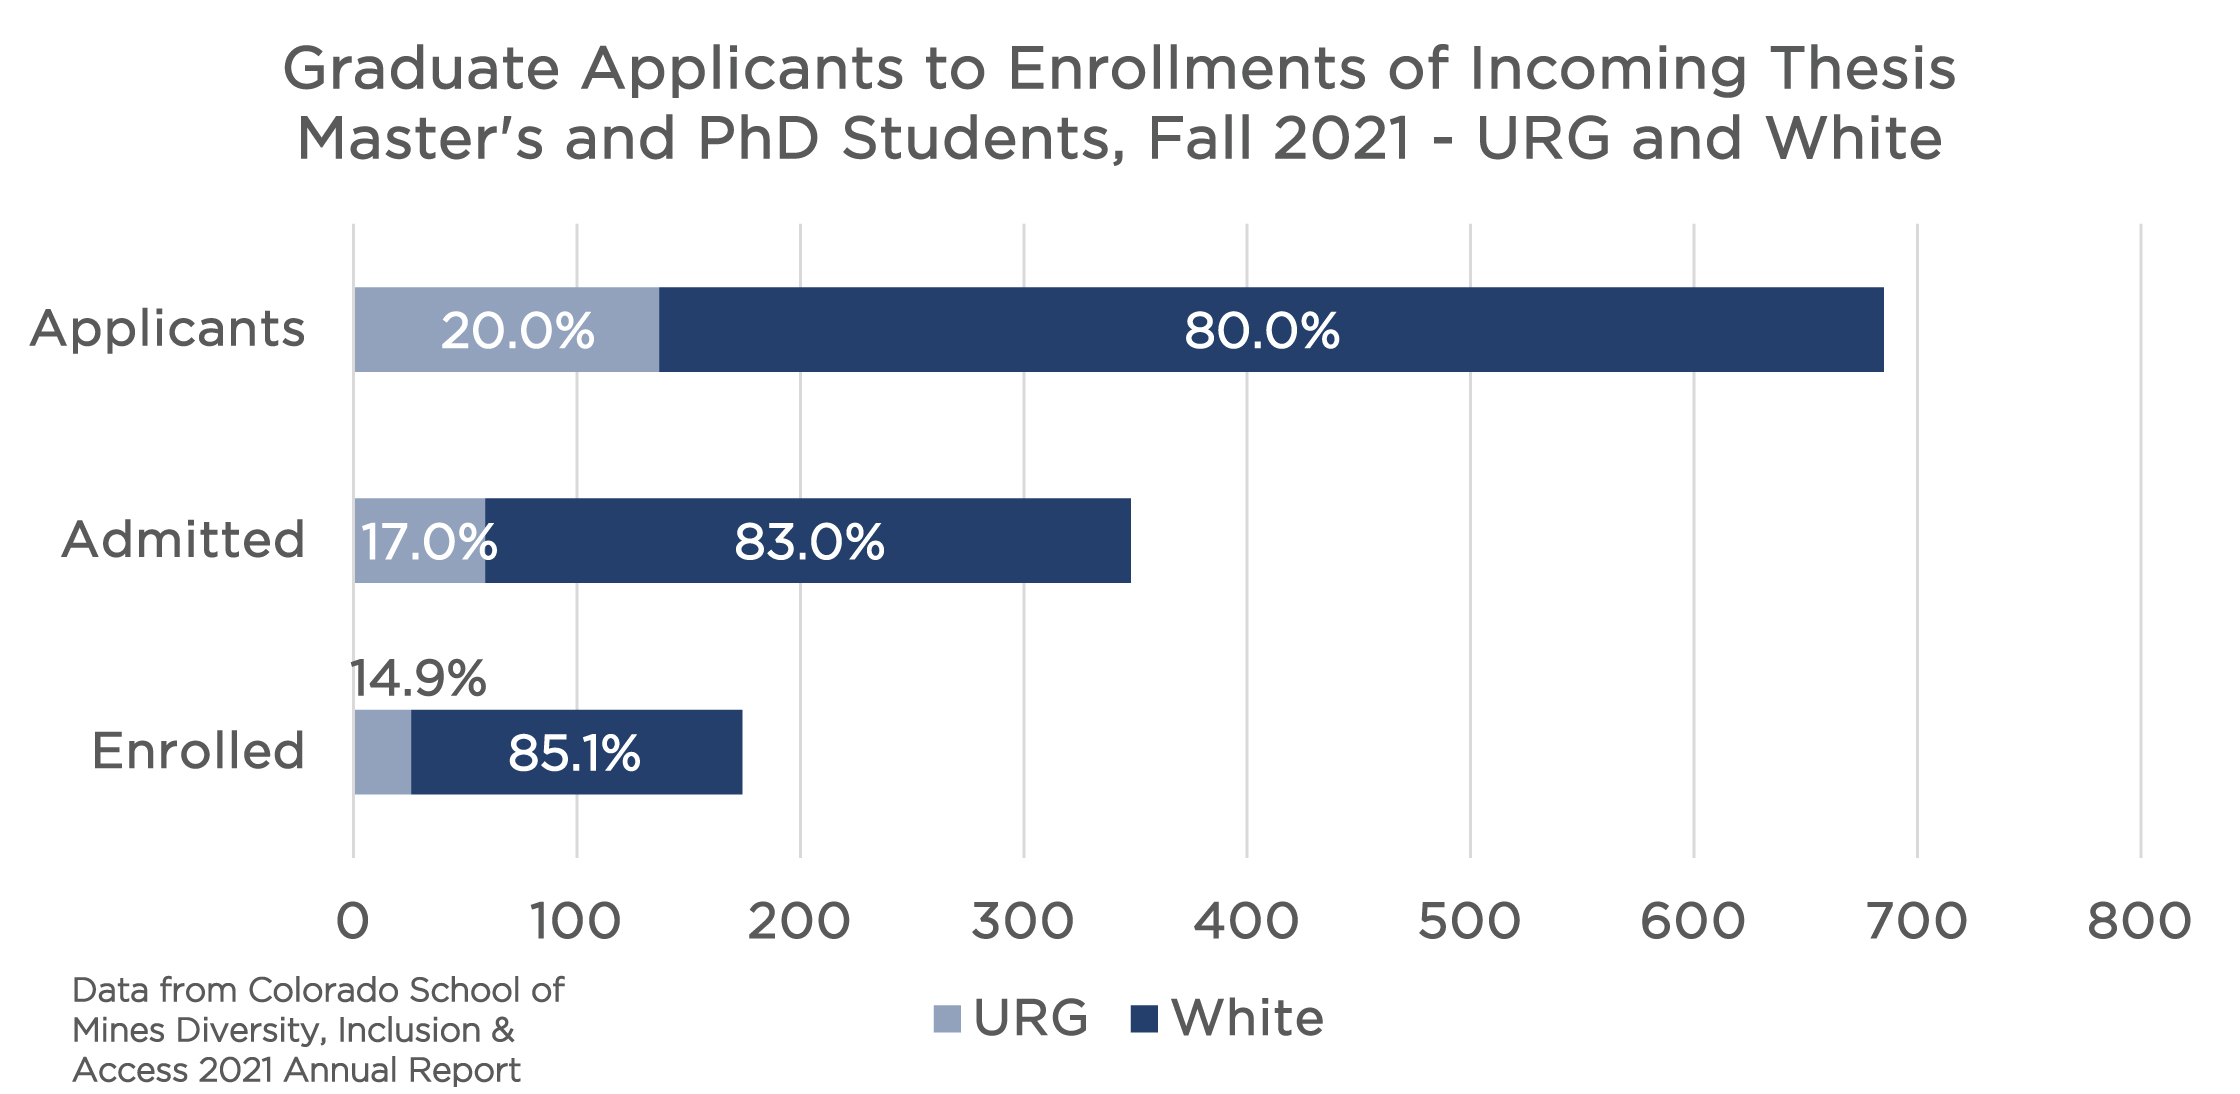 Click on graph image to view larger size Click on graph image to view larger size |
Employee Hiring
| Academic Faculty have specific hiring cycles and start each year in September. Because of this, the data presented include hires made for the 2021 Academic Year, which are hires made between August 2020 and July 2021 for a start date of August 2021. The recruitment cycle for the 2021 Academic Faculty hires was during the height of the pandemic in 2020. Thus, this had an impact on recruitment. For example, several faculty searches were cancelled during this time due to a campus hiring freeze in 2020. Notably, representation of racial/ethnic marginalized groups increased between 2020 and 2021. Both the Gender and Race/Ethnicity graphs contain “unknown” values as a result of candidates not disclosing demographic information. The term URG is “underrepresented groups” and includes those who identify as American Indian/Alaskan Native, African American/Black, Asian, Hispanic/Latinx, multiple races and Native Hawaiian/Pacific Islander. Gender is defined here as only either male or female due to limitations in data collection and reporting. | 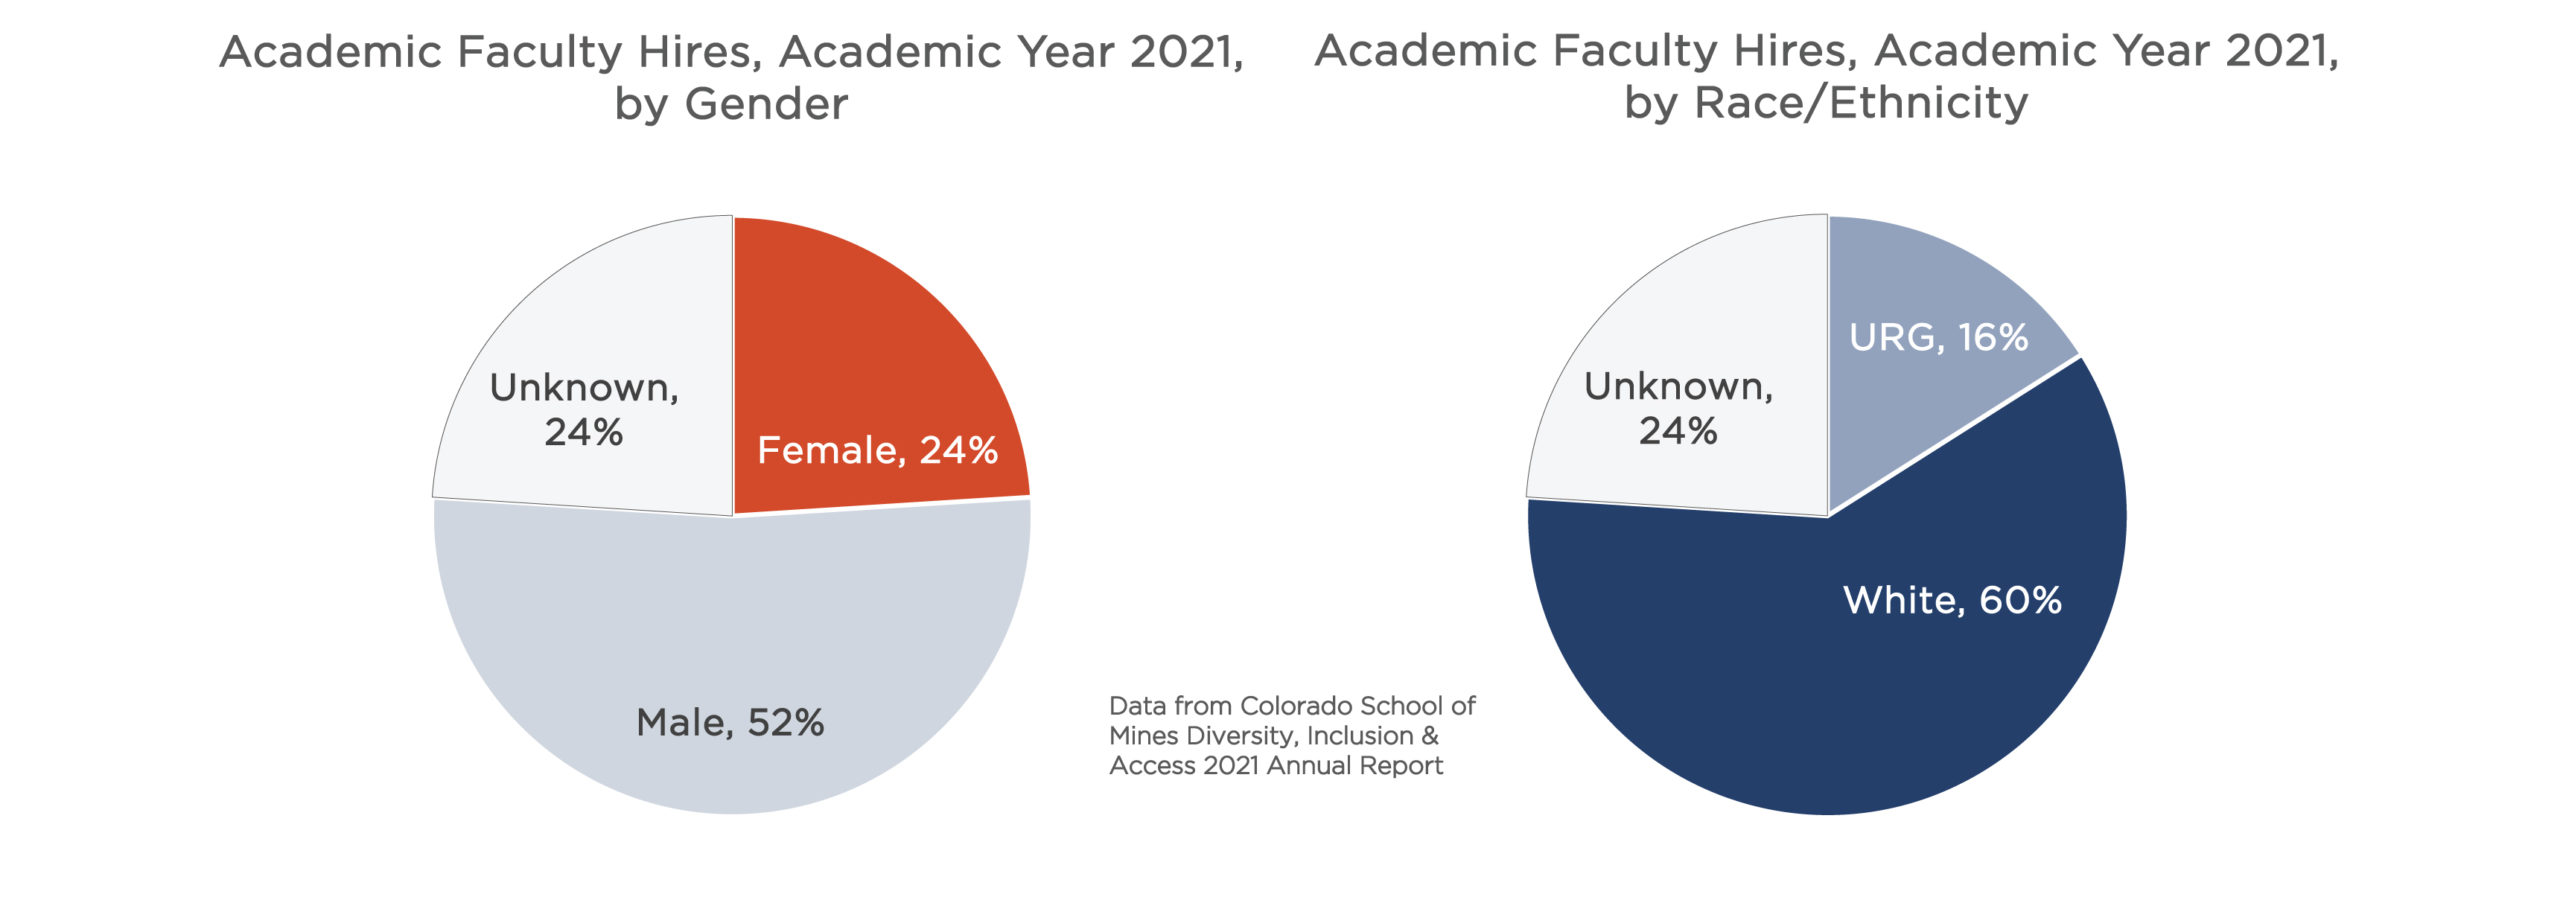
Click on graph image to view larger size |
| Administrative Faculty are hired throughout the calendar year. These data include new positions created for the institution, backfills (when an employee leaves and a new person is hired in the same position), and promotions for the fiscal year 2021. Notably, representation of racial/ethnic marginalized groups increased between 2020 and 2021. Both the Gender and Race/Ethnicity graphs contain “unknown” values as a result of candidates not disclosing demographic information. The term URG is “underrepresented groups” and includes those who identify as American Indian/Alaskan Native, African American/Black, Asian, Hispanic/Latinx, multiple races and Native Hawaiian/Pacific Islander. Gender is defined here as only either male or female due to limitations in data collection and reporting. | 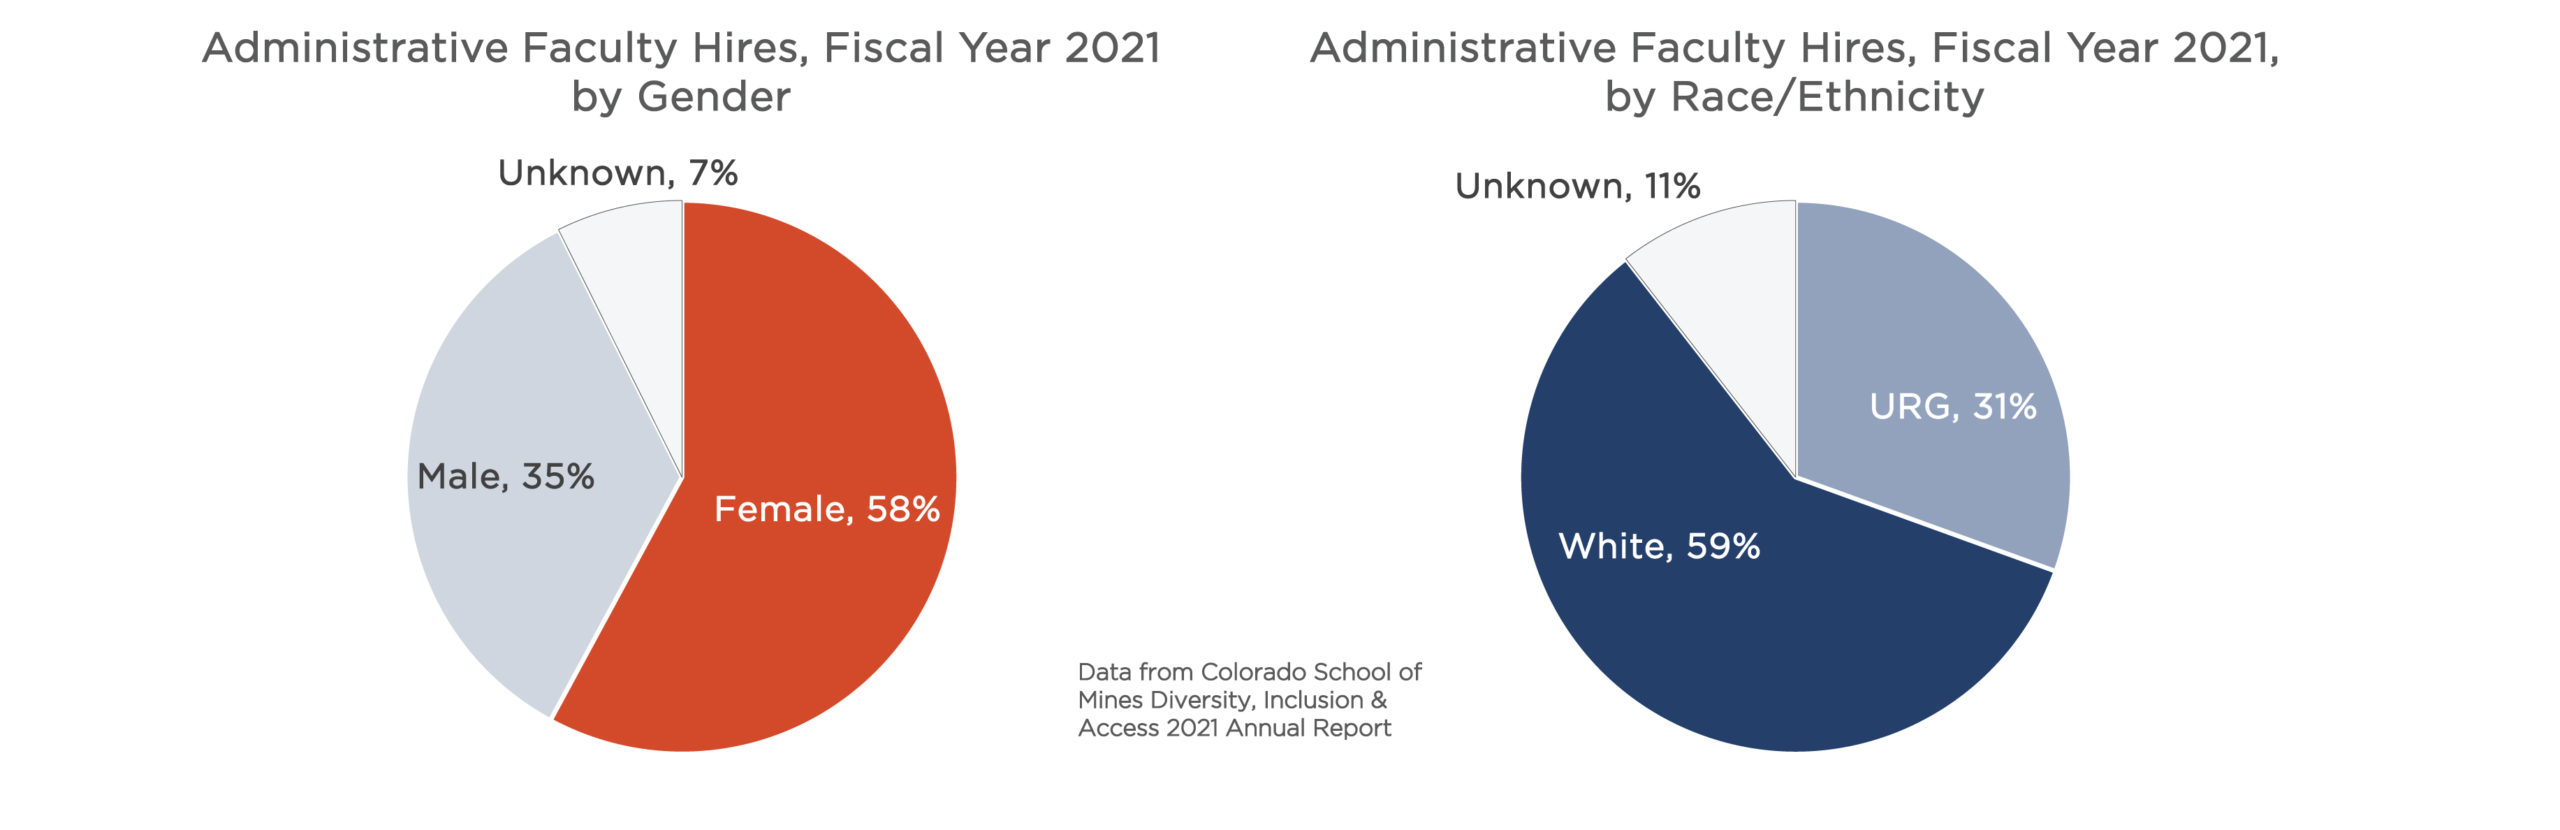 Click on graph image to view larger size Click on graph image to view larger size |
• Retention of Students and Employees •
The following graphs highlight retention trends for our undergraduate students, by different demographics as well as the turnover rates for Academic and Administrative faculty, by demographic.
Undergraduate Student Retention Rates
|
Overall, Mines has impressive fall-to-fall retention rates of our undergraduate students. These data represent the percentage of first-year students from their starting fall cohort who stay at Mines until the following fall. For example, in fall 2017, 92% of non-Pell first-year students stayed at Mines and enrolled in their sophomore year compared to 90% of Pell students. This graph shows the trends for all full-time, undergraduate first-year student populations by both Pell status (in silver and red) and first-generation status (in dark and light blue lines). Those who are Pell-eligible are students who come from lower-income families. Those who are first-generation are those who are the first in their families, other than siblings, to attend college. Notice that out of all four graphs representing fall-to-fall retention rates, the Pell-eligible students have the lowest retention rates overall. This is something Mines can consider investigating further to make sure these students have the appropriate support systems in place to ensure their success. |
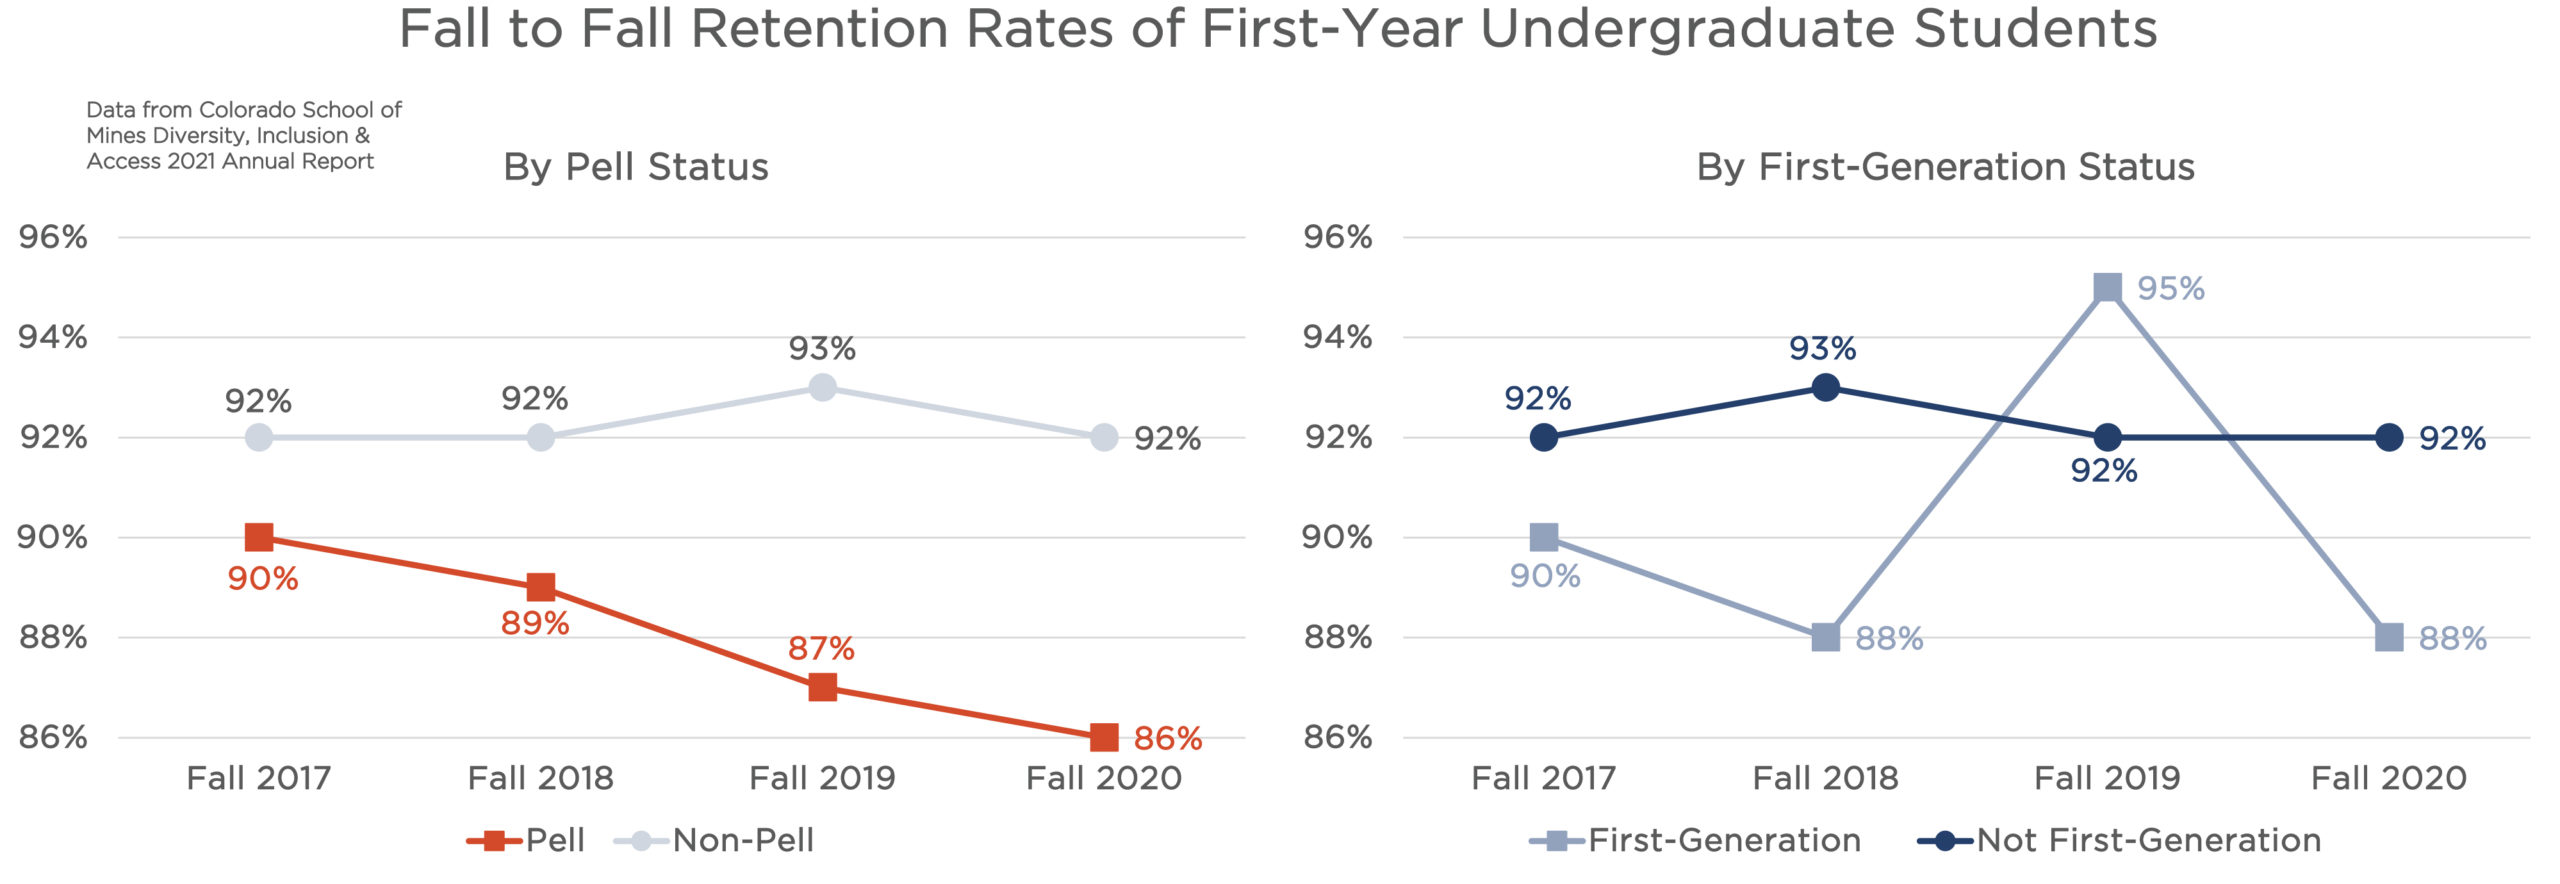 Click on graph image to view larger size Click on graph image to view larger size |
|
Overall, Mines has impressive fall-to-fall retention rates of our undergraduate students. These data represent the percentage of first-year students from their starting fall cohort who stay at Mines until the following fall. For example, in fall 2017, 93% of female-identifying first-year students stayed at Mines and enrolled in their sophomore year compared to 92% of male-identifying students. This graph shows the trends for all full-time, undergraduate first-year student populations by both gender (red and silver lines) and race/ethnicity (dark and light blue lines). Underrepresented is denoted by “URG” and include American Indian/Alaskan Native, African American/Black, Asian, Hispanic/Latinx, multiple races and Native Hawaiian/Pacific Islander populations. Gender is defined here as only either male or female due to limitations in data collection and reporting. |
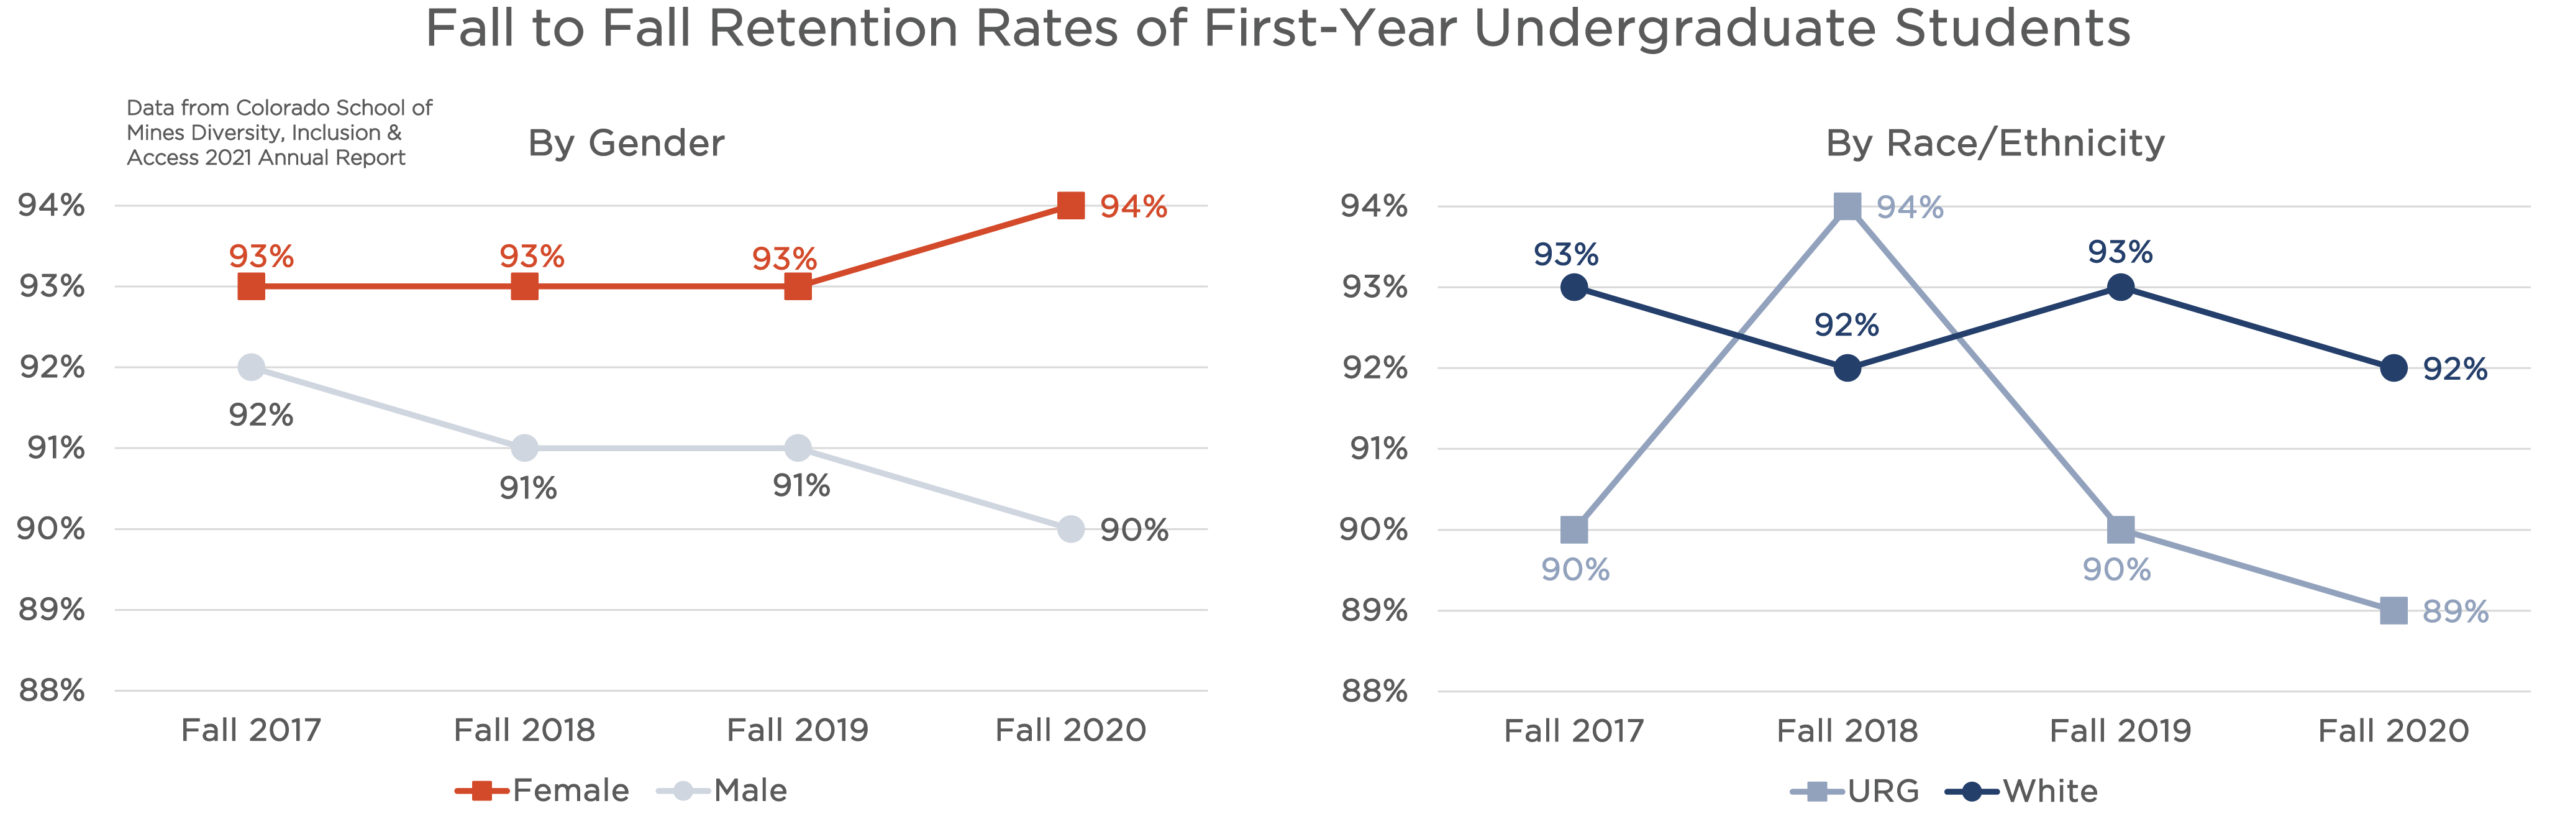 Click on graph image to view larger size Click on graph image to view larger size |
Faculty Turnover Rates
| Overall, there is generally low Academic Faculty turnover. What’s important to note is that turnover rates of our academic faculty of color (URG) remain particularly low, if not at 0%, for most fiscal years. Both female and male academic faculty also have comparable turnover rates, with an exception in FY 2019 when we observe a spike of 5.3% in female turnover. Surprisingly, turnover rates for female academic faculty drop back down to 1.0% in FY 2020 during the pandemic. Underrepresented is denoted by “URG” and include American Indian/Alaskan Native, African American/Black, Asian, Hispanic/Latinx, multiple races and Native Hawaiian/Pacific Islander populations. Gender is defined here as only either male or female due to limitations in data collection and reporting. | 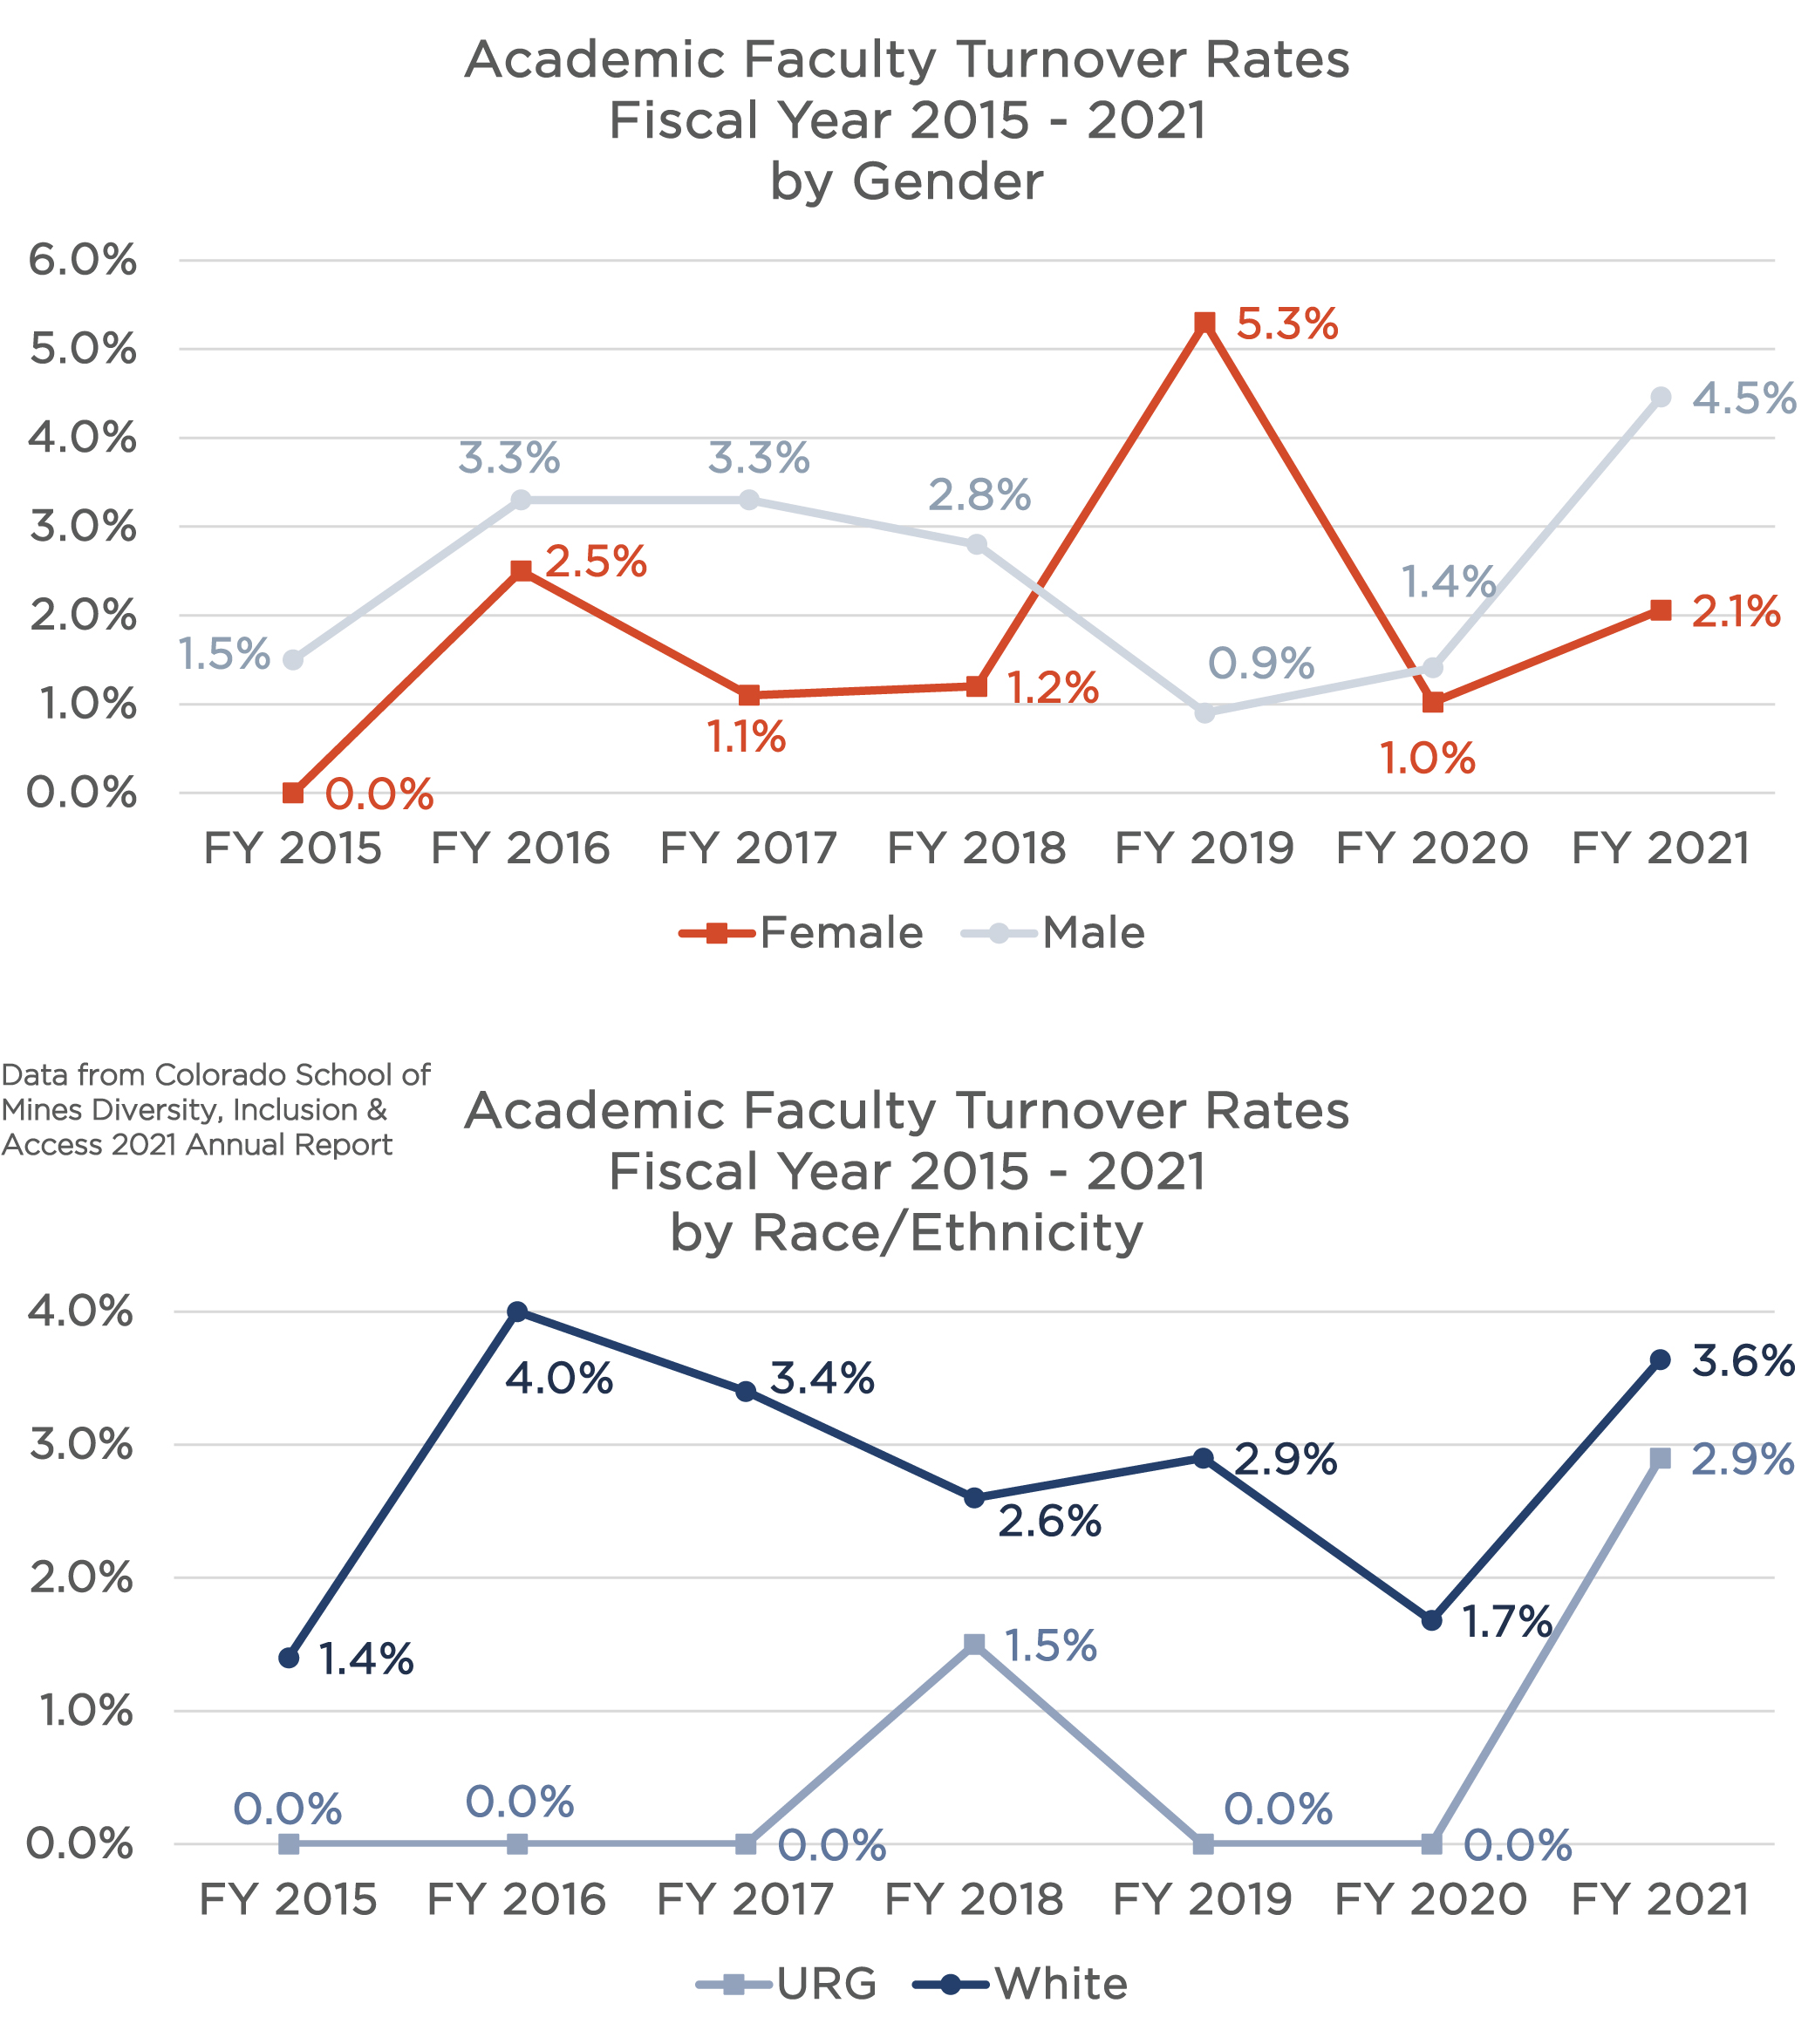 Click on graph image to view larger size Click on graph image to view larger size |
| Administrative Faculty have higher turnover overall compared to Academic Faculty. Turnover rates increased in FY 2019 and 2020 for both male and female employees, but particularly for male employees. Turnover rates by race and ethnicity show that employees of color (URG) left Mines at much higher rates compared to white employees in FY 2018, 2019 and 2020. This trend started prior to the pandemic but then during the pandemic, there was notably less turnover in FY 2021 for employees of color. Underrepresented is denoted by “URG” and include American Indian/Alaskan Native, African American/Black, Asian, Hispanic/Latinx, multiple races and Native Hawaiian/Pacific Islander populations. Gender is defined here as only either male or female due to limitations in data collection and reporting. | 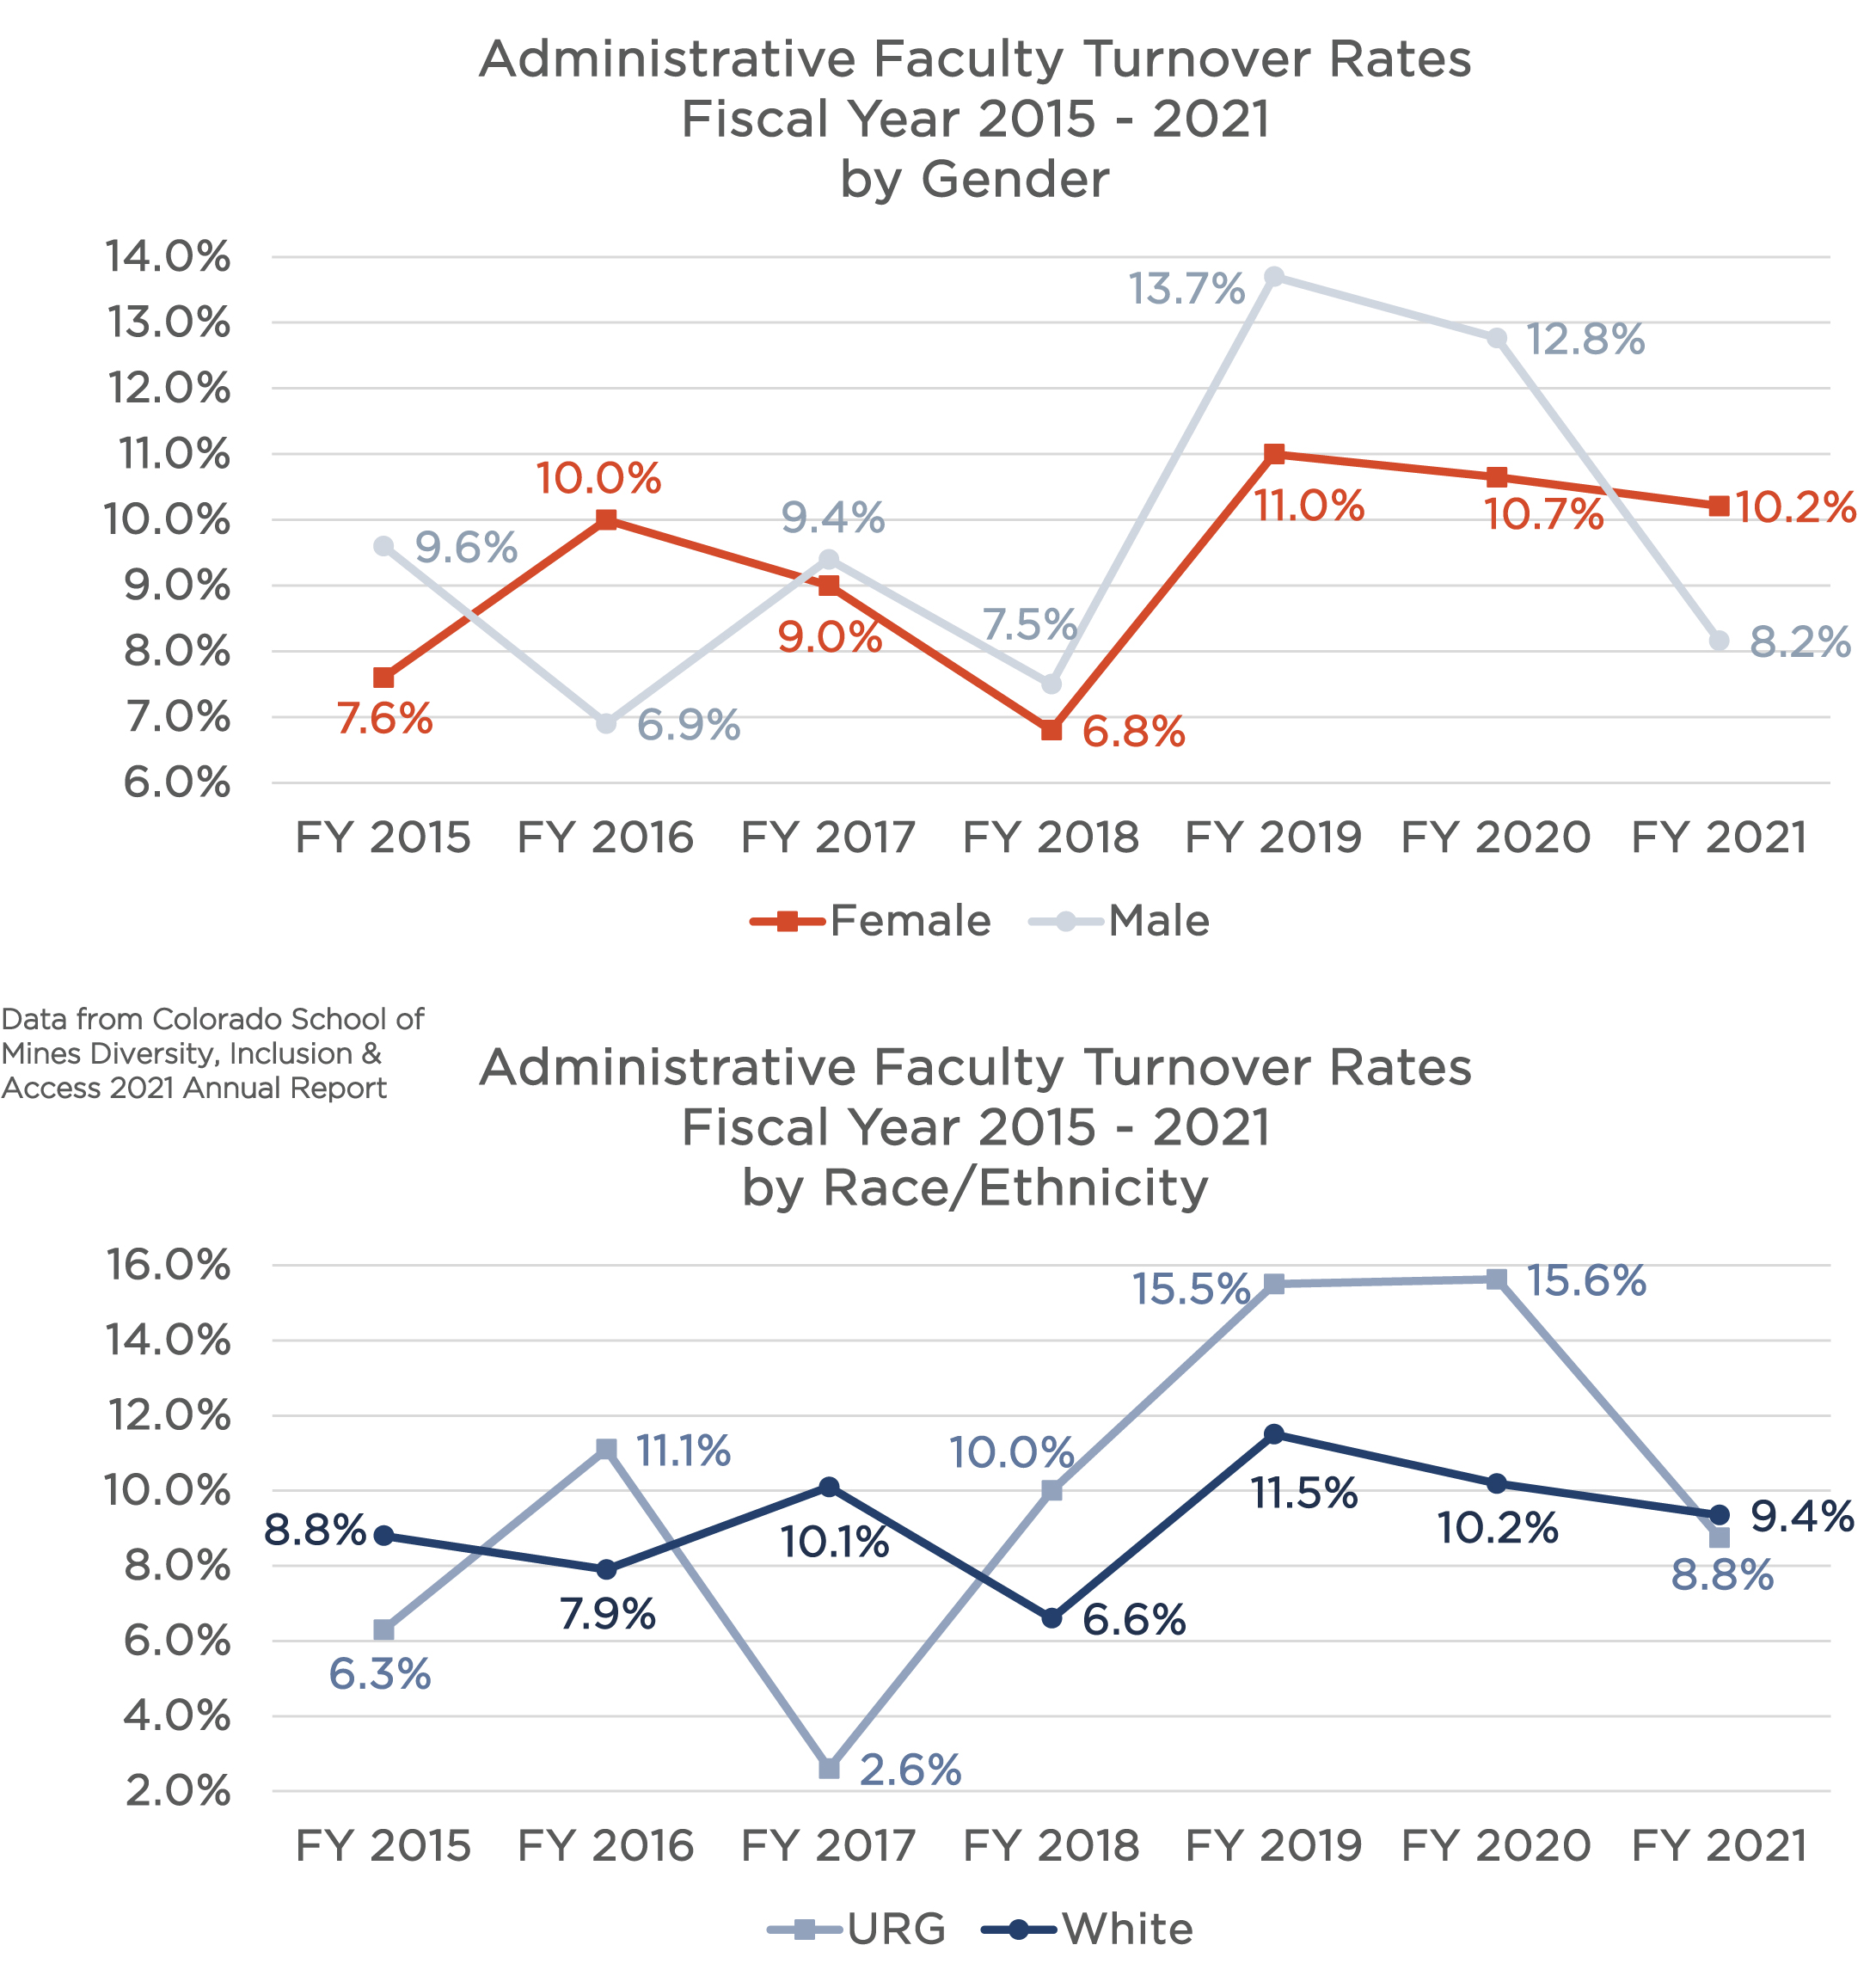 Click on graph image to view larger size Click on graph image to view larger size |
Mines Community Alliances (MCAs)
Mines Community Alliances (MCAs) are employee-run groups, sponsored by a representative in executive leadership, to support the professional development of its members. MCAs align with Mines’ strategic initiative to build a high-performing organization and create an inclusive workspace for all Orediggers. In 2021, the MCAs welcomed an additional group to the existing four – the Mines Asian Community Alliance (MACA).
• Shared Responsibility •
One of the key tenets of DI&A work for Mines is this idea of Shared Responsibility. Shared Responsibility means the entire Mines community participates in and is accountable for advancing the DI&A Strategic Plan goals and recommendations. We support everyone at Mines – from individuals to departments – to find their own way to contribute to DI&A. The following provides an outstanding example of Shared Responsibility at Mines.
Mines DI&A Fellows
The Mines DI&A Fellows program recognizes highly accomplished and motivated faculty and staff for their exceptional leadership and service, and provides support as they to gain experience and drive institutional change at Mines. Each Fellow champions a strategic initiative or program that furthers the vision and mission of Mines DI&A. Fellows also learn about all the inner-workings of Mines DI&A and serve as a representative for campus internally and externally.
| Dr. Derrick Hudson, Associate Teaching Professor from the Department of Humanities, Arts and Social Science is leading an educational and service-learning course titled, “Dialogues on Agency, Race, Citizenship, Society (ARCS) and STEM.” This course partners selected Mines students with college students at the iSSACHAR Center for Urban Leadership, a non-profit organization Dr. Hudson helped to establish in the early 2000s. Students enroll in this program to gain leadership and academic exposure to important issues in politics, economics, culture and spirituality. This initiative falls under the DI&A Recruitment, Retention, Culture of Inclusion and Fostering Dialogue goals. This course, which is taught at the Issachar Center, seeks to create a sustainable location for partnering Mines and Issachar students in one of Denver’s historic African American neighborhoods, the Five Points and Whittier communities. It is hoped that over time, this course will begin to attract students of color who will aspire to view Mines as a “top-of-mind” goal to pursue STEM degrees and careers. Review the full description of Dr. Hudson’s efforts and outcomes so far in this document. | 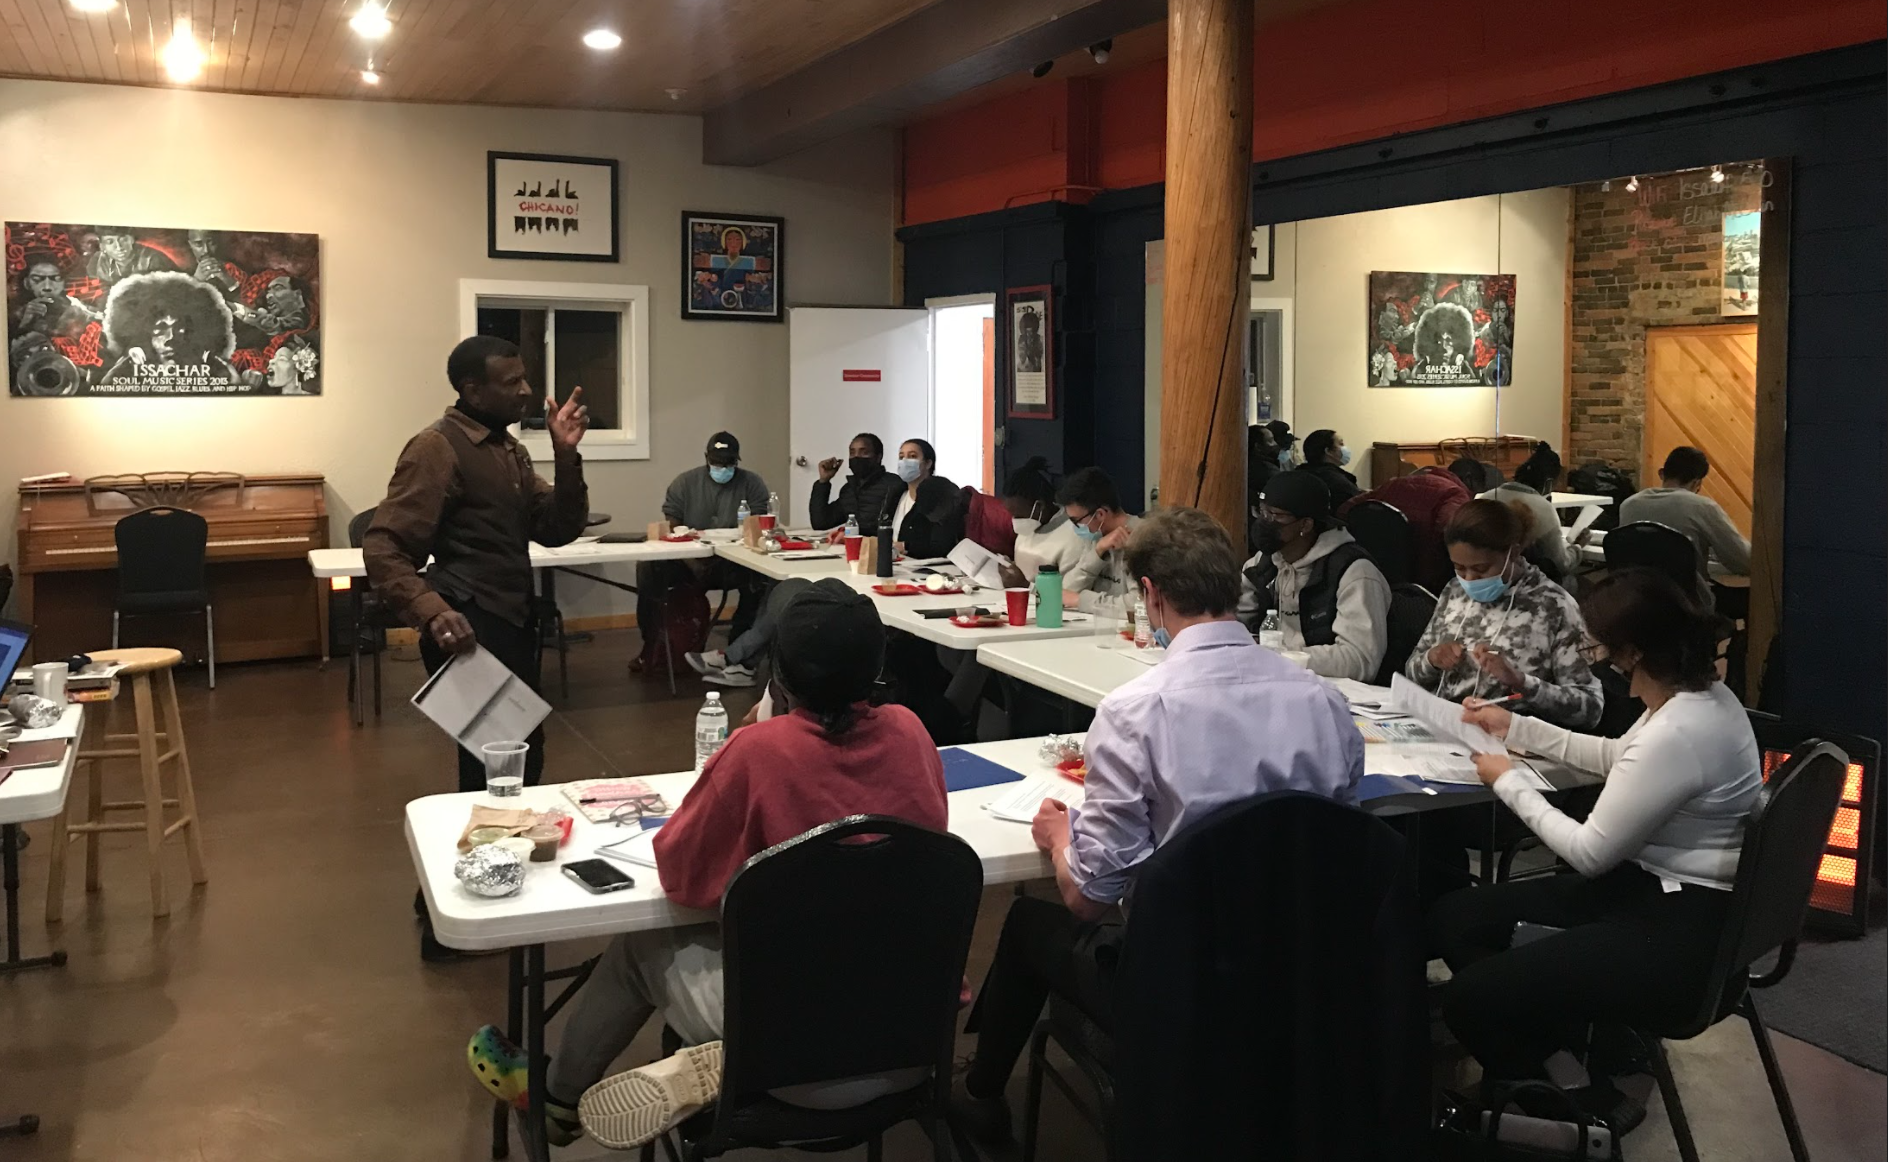 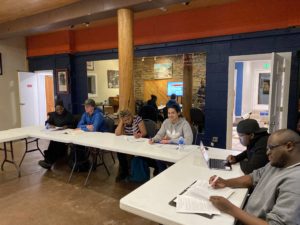 |
Alexandria Leach, Assistant Director, Case Management and Clery Compliance is leading a project to develop a toolkit for student leaders that will address issues of social justice, equity, and access. As the project developed over the past year, the issue that continues to come to the forefront of conversation is the need for leaders to be able to engage their peers in dialogue related to heavy topics, and so the project has come to center around the area of developing training and support for leaders to foster these spaces. Current work has included building connections and relationships with staff and student groups in Student Life to encourage cross-collaboration as efforts exist to increase space for dialogue. Future goals of the project include bringing in trainers to help students understand how to facilitate dialogue and eventually developing a Mines specific training that can be facilitated in-house for student leaders.
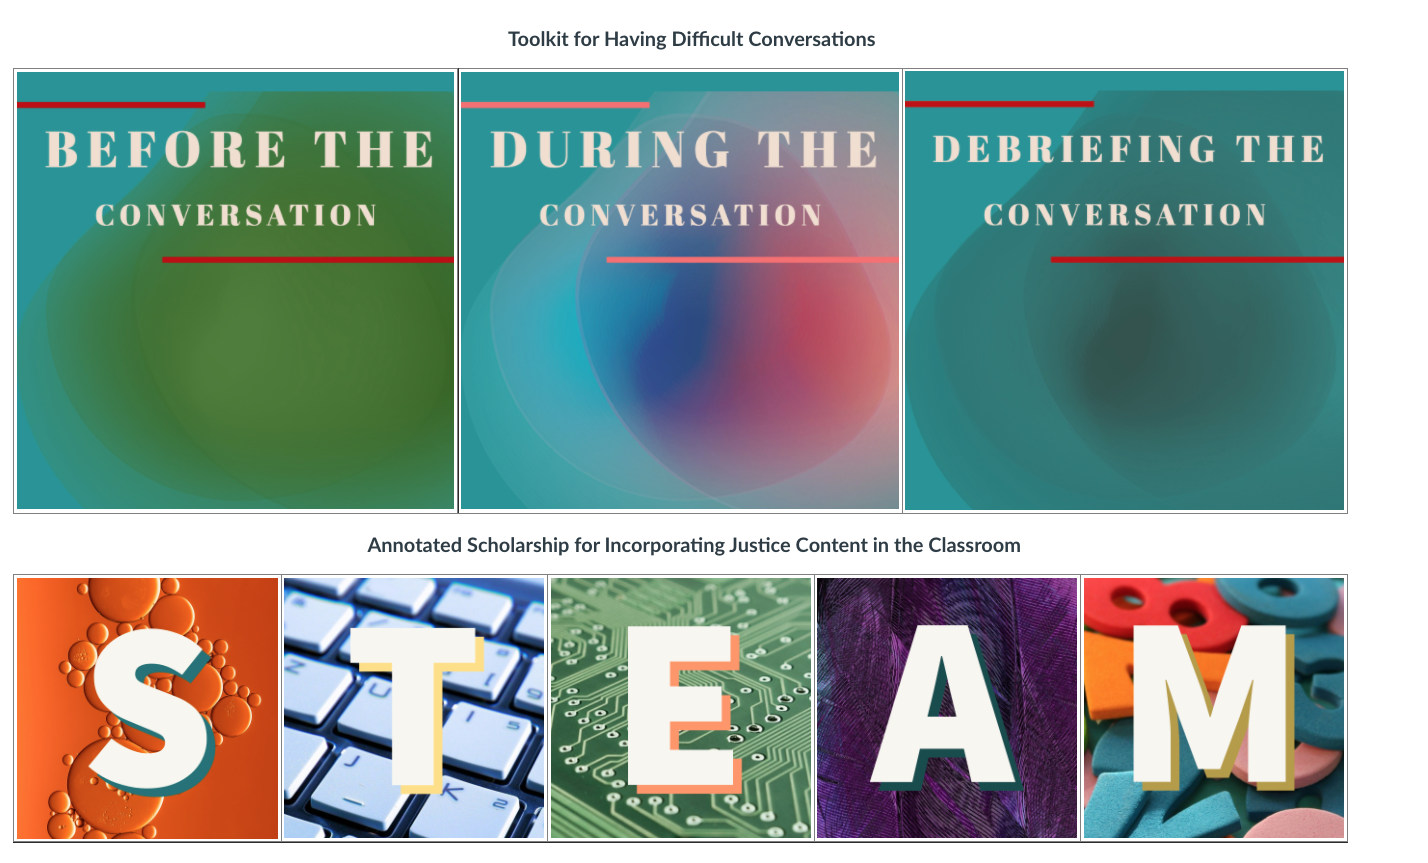
Dr. Shannon Mancus, Associate Teaching Professor from the Department of Humanities, Arts and Social Science is leading a project that aims to provide two critical DI&A-related resources to Mines faculty members. The first is a document that shows how DI&A content can be scaffolded throughout the curriculum; the second is a collection of resources for planning and facilitating difficult conversations in the classroom and beyond.
Throughout the semester, Dr. Mancus has communicated with faculty members across the CORE to assess what key terms and concepts that relate to DI&A are already being taught in our classes. She is using the data that she gathered to create a document that shows what concepts and terminology students are already learning in their foundational classes, so that professors in upper-level courses can build more intentionally on the knowledge that students already have about topics like bias and environmental justice.
This document will be housed on a Canvas page for faculty, along with myriad resources that will help faculty members have conversations around DI&A issues in their classrooms.
This project was borne out of conversations with colleagues about hesitancies surrounding having tough discussions in their classrooms. Many faculty members would like to introduce more DI&A content into their courses, but feel unsure or unpracticed when it comes to managing conversations around topics that can become contentious.
In 2021, Dr. Mancus researched and compiled effective methodologies for guard railing conversations around justice issues that can be implemented before, during, and after having difficult discussions in the classroom. By the end of spring 2022, faculty will be able to go to Canvas to build a toolbox of resources and choose effective tactics in a low-stakes, digital simulation of a classroom discussion.
The purpose of these resources, when taken together, will make it easier for professors to have more in-depth and structured conversations around DI&A that are productive and scaffolded across the curriculum.
Dr. Justin Shaffer, Associate Teaching Professor from the Department of Chemical and Biological Engineering is pursuing two Department of Education Upward Bound grants, which will provide college preparation and support to low income, first–generation high school students. In collaboration with Mines Admissions team, Lori Kester, Dale Gaubatz, and Louisa Duley, Mines has partnered with West High School in Denver, which has significant need for a program such as this. We are currently in discussions with other schools in the Denver and Jefferson County areas for interest in a second program. The Upward Bound RFP was due January 31, 2022. More information on Upward Bound can be found at this website.
Unit Implementation Plan Progress Reports
| This graph shows the most common programs and activities found in units’ implementation plan progress reports, which were submitted in spring 2021. Out of the 35 progress reports submitted, 29 of them indicated their unit engaged in some form of DI&A professional development for their employees or students. These citations are in addition to the 25 units who conducted learning and development workshops specifically on DI&A-related topics. Many more activities are listed, which demonstrate the breadth and depth commitments Orediggers have to DI&A. |
|

• Culture of Inclusion •
Ensuring a strong culture of inclusion is one of the primary pillars of DI&A-related work. Without it, increasing diversity through recruitment, retention, access and equity efforts becomes moot. We can’t retain and sustain diversity without inclusion. Mines continues to spearhead ways to build cultural inclusion among all groups on campus.
Climate surveys for campus: ModernThink for employees, Trefny climate survey for students, "out in STEM" climate survey about the LGBTQ+ community experience, and Viewfinder climate survey for all of campus.
Groups on campus participate in learning and development around DEI topics, including implicit bias, microaggressions or gender equity, for example.
%
of Academic Departments foster inclusive classrooms by using the Trefny Inclusive Classroom Checklist.
Out in STEM (oSTEM) Climate Survey
- LGBTQ+ Participants’ Perspectives
- Non-LGBTQ+ Participants’ Perspectives
- How Identity Impacts Learning Experiences
|
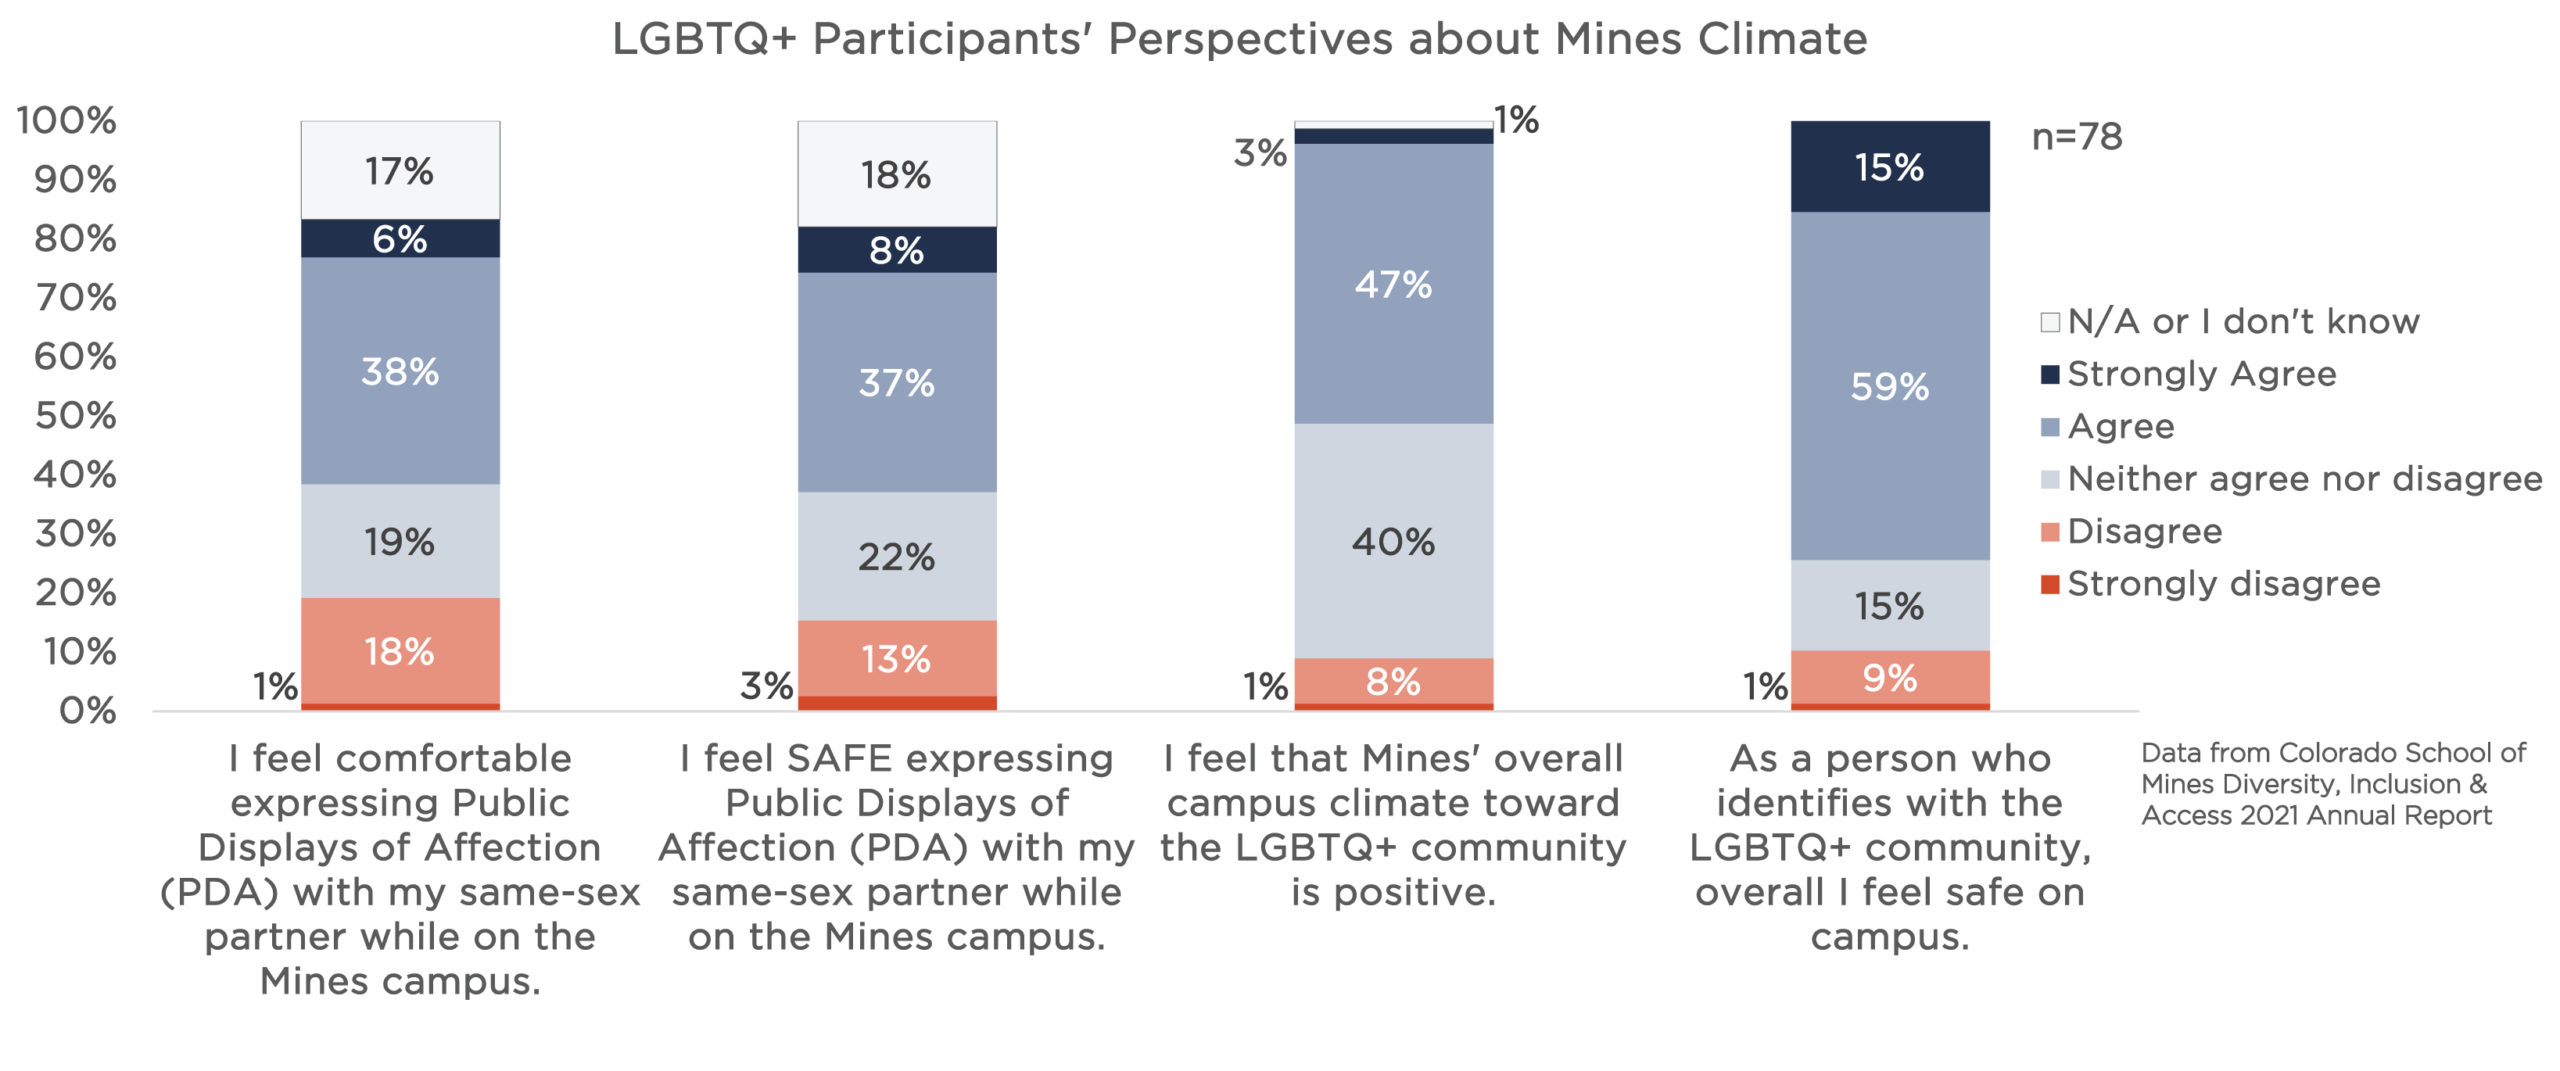
There were 78 people who identified with the LGBTQ+ community that took the oSTEM survey in spring 2022. Almost 50% of respondents feel comfortable and safe expressing public displays of affection with their partners on campus. There were 50% of respondents who feel the Mines’ overall climate is positive toward the LGBTQ+ community. Furthermore, nearly three-quarters of respondents say they feel safe on campus as an LGBTQ+ identifying person. LGBTQ+ is defined as Lesbian, Gay, Bisexual, Transgender, Queer/Questioning, Intersex, Asexual and additional identities. |
Click on graph image to view larger size |
|
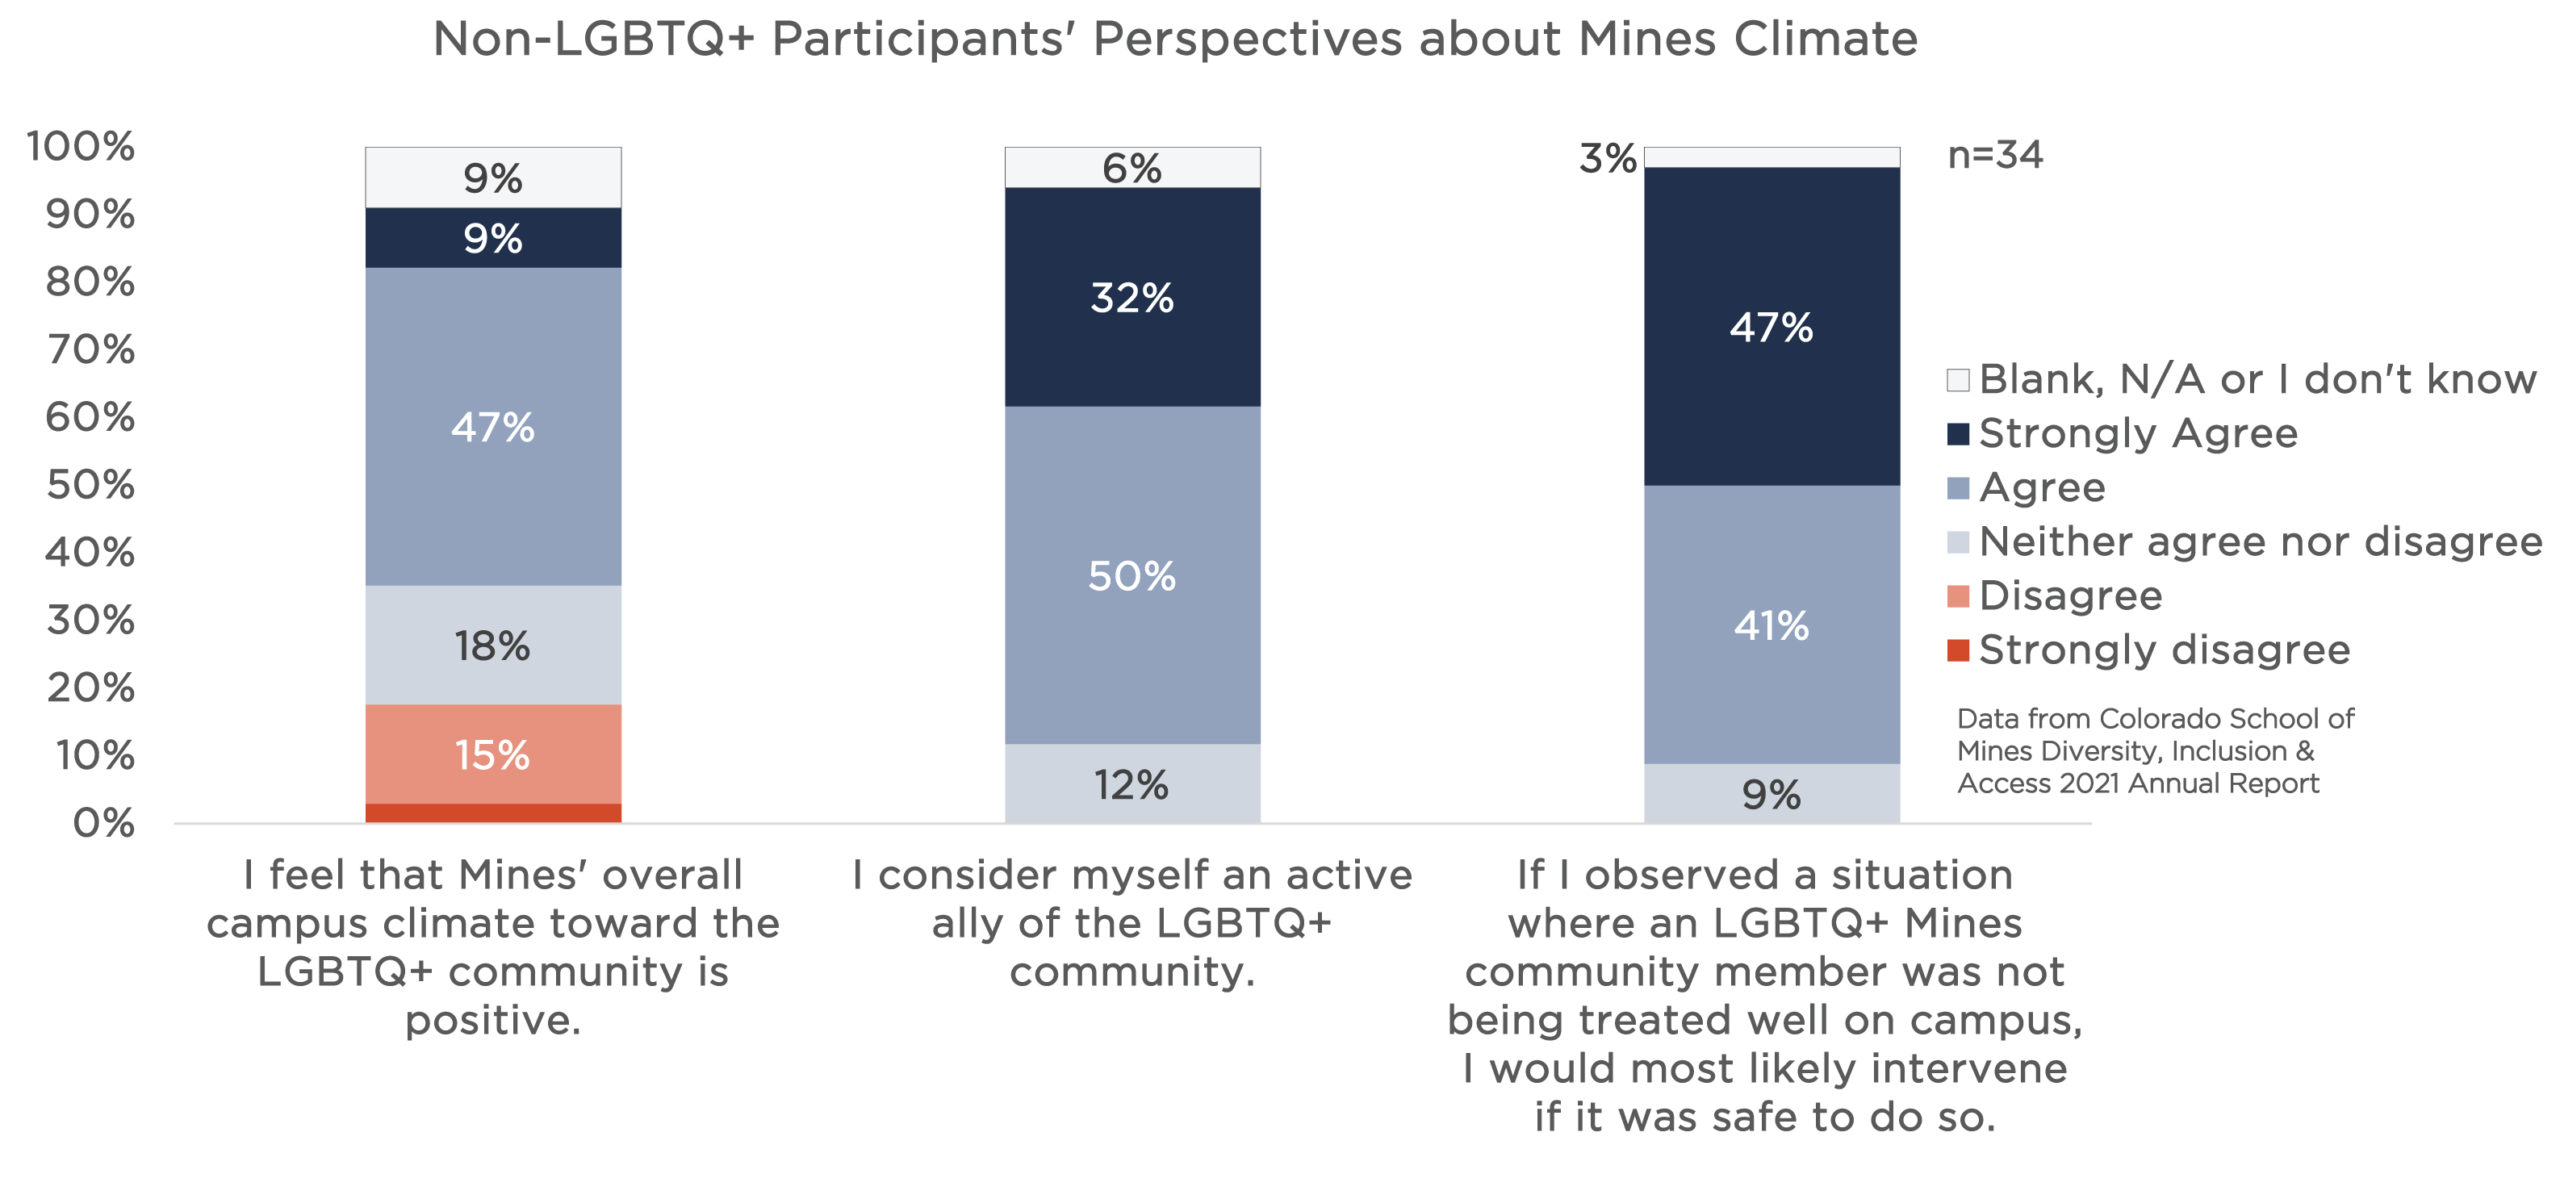
There were 34 people who do not identify with the LGBTQ+ community that took the oSTEM survey in spring 2022. Over 50% say they think the Mines’ climate overall is positive toward the LGBTQ+ community, which is a slightly higher percentage than the LGBTQ+ responses. Over 80% of respondents say they are active allies of the LGBTQ+ community, though that is unsurprising given the self-selection of participants in the survey. Almost 90% of respondents indicated they would intervene if they observed a situation on campus where an LGBTQ+ community member wasn’t being treated well. LGBTQ+ is defined as Lesbian, Gay, Bisexual, Transgender, Queer/Questioning, Intersex, Asexual and additional identities. |
Click on graph image to view larger size |
|
Both populations, those who are LGBTQ+ and those who are not, feel similarly positive (over 80% for each) that students’ experiences regarding both their gender identity and their sexuality can have impacts on their learning. LGBTQ+ is defined as Lesbian, Gay, Bisexual, Transgender, Queer/Questioning, Intersex, Asexual and additional identities. Gender identity is each person’s internal and individual experience of gender. It is a person’s sense of being a woman, a man, both, neither, or anywhere along the gender spectrum. A person’s chosen name and pronoun are also common ways of expressing gender. Sexuality, sexual/romantic identity/orientation is how people think of themselves in terms of whom they are romantically or sexually attracted to. |
Click on graph image to view larger size |

Students Registered for Accommodations with Disability Support Services
%
Fall 2019 annual increase in students registered with accommodations from previous year
%
fall 2020 annual increase in students registered with accommodations from previous year
%
fall 2021 annual increase in students registered with accommodations from previous year
• Foster Dialogue •
To raise awareness of the importance of DI&A, both at the institutional level and at the individual level, Mines creates and implements campus-wide communications and activities that foster dialogue about DI&A topics. This year, the community fostered dialogue about DI&A through:
- Celebration of DI&A at Mines Symposium
- DI&A Table During the “Making the Connection” Event
- Student Life Class Employee Real Talk Initiative
- “DI&A Minute” with Petroleum Engineering
- “Community Conversations” with Arthur Lakes Library
- MCA Professional Development Workshops
• Rewards & Recognition •
Mines places great emphasis on everyone contributing to the DI&A mission. That shared responsibility is central to Mines making forward progress as we approach MINES@150. As everyone continues to contribute to this cause, it’s imperative we reward and recognize those who find ways to support DI&A across campus and contribute to its success. In fact, formal recognition validates the work and encourages sustain efforts in this space.
In addition, we would like to recognize that Mines was elevated in 2021 as an institution that has “Very High Research Activity” (formerly known as an R1 institution) by the Carnegie Classification of Institutions of Higher Education. There are fewer than 150 universities with this designation out of nearly 4,000 in the United States. To learn more about this impressive milestone, read the Mines Newsroom press release. This accomplishment emphasizes the progress made on DI&A-related broader impacts of our scientific and engineering proposals.