T o remain competitive in an increasingly global and dynamic higher education and STEM landscape, Mines’ community members of students, faculty and staff need to match the demographics of the populations from which it draws talent. We aim for Mines to match the demographics outlined on page nine in the Strategic Plan for DI&A. Mines began introducing new initiatives to improve recruiting using best practices in admissions, scholarship programming, financial aid and hiring of employees, to name a few.
For the undergraduate admissions office at Mines and across the country, it’s unclear what the future holds. Mines is building a strategy for the future to be adaptable to the changing admissions environment. However, unlike undergraduate admissions, graduate admissions processes are not conducted by one office, but rather individually at the program level. Each program has admissions committees who make decisions based on their unique requirements.
Coming Soon…
 Work the Numbers
We will be making our data available via the Tableau platform and invite you to see what insights you can glean for yourself.
Strategy for
K-14 Pipeline
Coordination and excellence

Financially Accessible
and Attractive
to students with diverse backgrounds
Coordinated Campus
Strategy
to recruit graduate students with diverse backgrounds
Broaden the Diversity of Faculty and Staff
by continuing & institutionalizing hiring best practices

Key Highlights and Opportunities
Highlights:
- Increase 2-year college transfer pathways through the new Associate in Engineering Science degree program with the Colorado Community College System (CCCS).
- Mines welcomed its most diverse incoming undergraduate class ever in fall 2021 with 33% women and 27% students of color.
- Enrollments of thesis graduate students of color and hires of Academic Faculty of color continue to increase, 15% and 16% respectively for fall 2021.
Opportunities:
- Continue updating articulation agreements for community colleges along the front range, including making policies consistent, updating procedures for accepting credits and modernizing student advising practices.
- Formulate strategies and expand upon current ones to extend fellowships to graduate students in need.
- Broaden the diversity of faculty at Mines through updated and expanded Hiring Excellence programming.
The modern admissions environment in higher education is a changing and dynamic landscape, largely due to the COVID-19 pandemic. Prospective students’ behaviors and decision-making processes regarding college acceptance have been altered; students are waiting longer into the admissions cycle to provide their intent to enroll, while others are taking advantage of test-optional admissions policies. Test-optional, in particular, was a huge driver of diversity at Mines because it presented an opportunity to students to consider applying who historically didn’t think they could come to Mines. Furthermore, it helped diversify the incoming class economically – students whose families that don’t have the means for additional test preparation courses or to pay for retaking the tests were able to consider Mines as a viable option without the additional testing barriers. For these reasons, fall 2021 marked Mines’ largest and most diverse incoming first-year class in its history with 1,449 new (non-transfer) students enrolled.
For the admissions office at Mines and across the country, it’s unclear what the future holds. We’re building a strategy for the future to be adaptable to the changing admissions environment.
In January 2021, Professor Gus Greivel was appointed as the Assistant Dean of Transfer Student Enrollment and Articulation to improve transfer pathways from 2-year colleges into Mines. A number of efforts led by Professor Greivel have made inroads into making Mines more accessible to 2-year college transfer students.
First, updating articulation agreements for community colleges along the Front Range is underway. This includes making the policies consistent across 2-year institutions, updating the procedures for accepting credits and modernizing student advising practices. To ensure 2-year college curriculum is transferred to Mines with minimal credit hour loss, Mines faculty are hosting workshops with community college faculty to build out an equivalent and transferable curriculum for certain courses.
Mines has worked with the Colorado Community College System (CCCS) to author a brand-new degree program specifically tailored for CCCS students hoping to transfer into any degree program at Mines. The Associate in Engineering Science degree program is a partnership between Mines and the CCCS that allows for a smoother transfer process from community colleges to Mines, increasing access to the institution.
Another homerun for increasing access to Mines for 2-year college students is the newly developed Mines Academy. This innovative transfer program guarantees admission to any four-year degree program at Mines for students enrolled in the Academy pursing the Associate in Engineering Science degree at Red Rocks Community College. Students in the Academy will complete coursework that aligns closely with Mines’ curriculum while taking advantage of what Mines has to offer such as attending sporting events or E-days, for example.
The Summer Multicultural Engineering Training (SUMMET) program is an engineering, science and technology program designed for rising juniors and seniors who are from underrepresented populations, including ethnic/racial marginalized populations, women and prospective first-generation college students. SUMMET combines coursework, active-learning projects, industry tours, team-building activities and social events to provide exposure to the lifestyle, opportunities and challenges of college. It is designed to help build skills and experiences for a smooth transition from high school to college. SUMMET is a one-week residential program, allowing participants to live on campus for the duration of the program, experience life as a college student and participate in STEM-related curriculum instruction.
 The Multicultural Engineering Program (MEP) runs the Challenge program every summer. Challenge is a four-week summer academic transitional program for selected incoming first-year students. Participants include students that are historically underrepresented in STEM (Science, Technology, Engineering & Mathematics) education, including ethnic and racial marginalized students, women and first-generation students. Taught by dedicated Mines’ faculty, the two required Challenge courses are MATH100 (Pre-calculus) and CHGN111 (Intro. to Chemistry). Included in the four-week curriculum is an engineering workshop focused on User-Centered Design. Participants also attend mandatory tutoring and workshops facilitated by staff from the Center for Academic Success and Advising (CASA) and other campus partners. Challenge builds on participants’ technical skills and connects them to faculty, staff and upper-class students who will be instrumental in navigating their success while attending Mines. Challenge students also participate in team-building activities and a community outreach project designed to help build camaraderie between peers. Participants must successfully complete all the program requirements to be fully admitted and matriculate to the fall semester. Generously funded by corporate partners, all costs for the four-week Challenge Program are covered for students, including room and board, textbooks, class materials and transportation to off-campus activities.
Partnerships with Outside Organizations and New Initiatives
The Enrollment Management office has been working over the last year to partner with Community Based Organizations (listed below) and other Mines initiatives in order to attract underrepresented groups to Mines. Some of these include:
Upward Bound Grants
Dr. Justin Shaffer, Associate Teaching Professor from the Department of Chemical and Biological Engineering is pursuing two Department of Education Upward Bound grants, which will provide college preparation and support to low income, first-generation high school students. To learn more about Mines’ submissions, please read Dr. Shaffer’s DI&A Fellows project description.
Applications to Enrollments of Mines new Undergraduate Students, 2021
- Enrollment Yield
- Enrollment Pipeline by Gender
- Enrollment Pipeline by Race/Ethnicity
- 2010/2020 Enrollment Pipeline by Gender
- 2010/2020 Enrollment Pipeline by Race/Ethnicity
| The data show the number of admitted vs. enrolled students in fall 2021, for all new first-year and transfer domestic and international students. Our yield rates (the number of students enrolled divided by the number admitted) for women and students of color (18.8% and 19.7%, respectively) are lower than the rates for men and white students (24.1% and 23.4%, respectively). Mines’ goal by MINES@150 is for our incoming class to be representative of the demographics of Colorado, as outlined on page nine of the Strategic Plan for DI&A. Updated data can be found on the WICHE website. To achieve gender parity and 40% students of color as indicated by the dotted lines, we would need yield rates to be 29% for both women and students of color. | 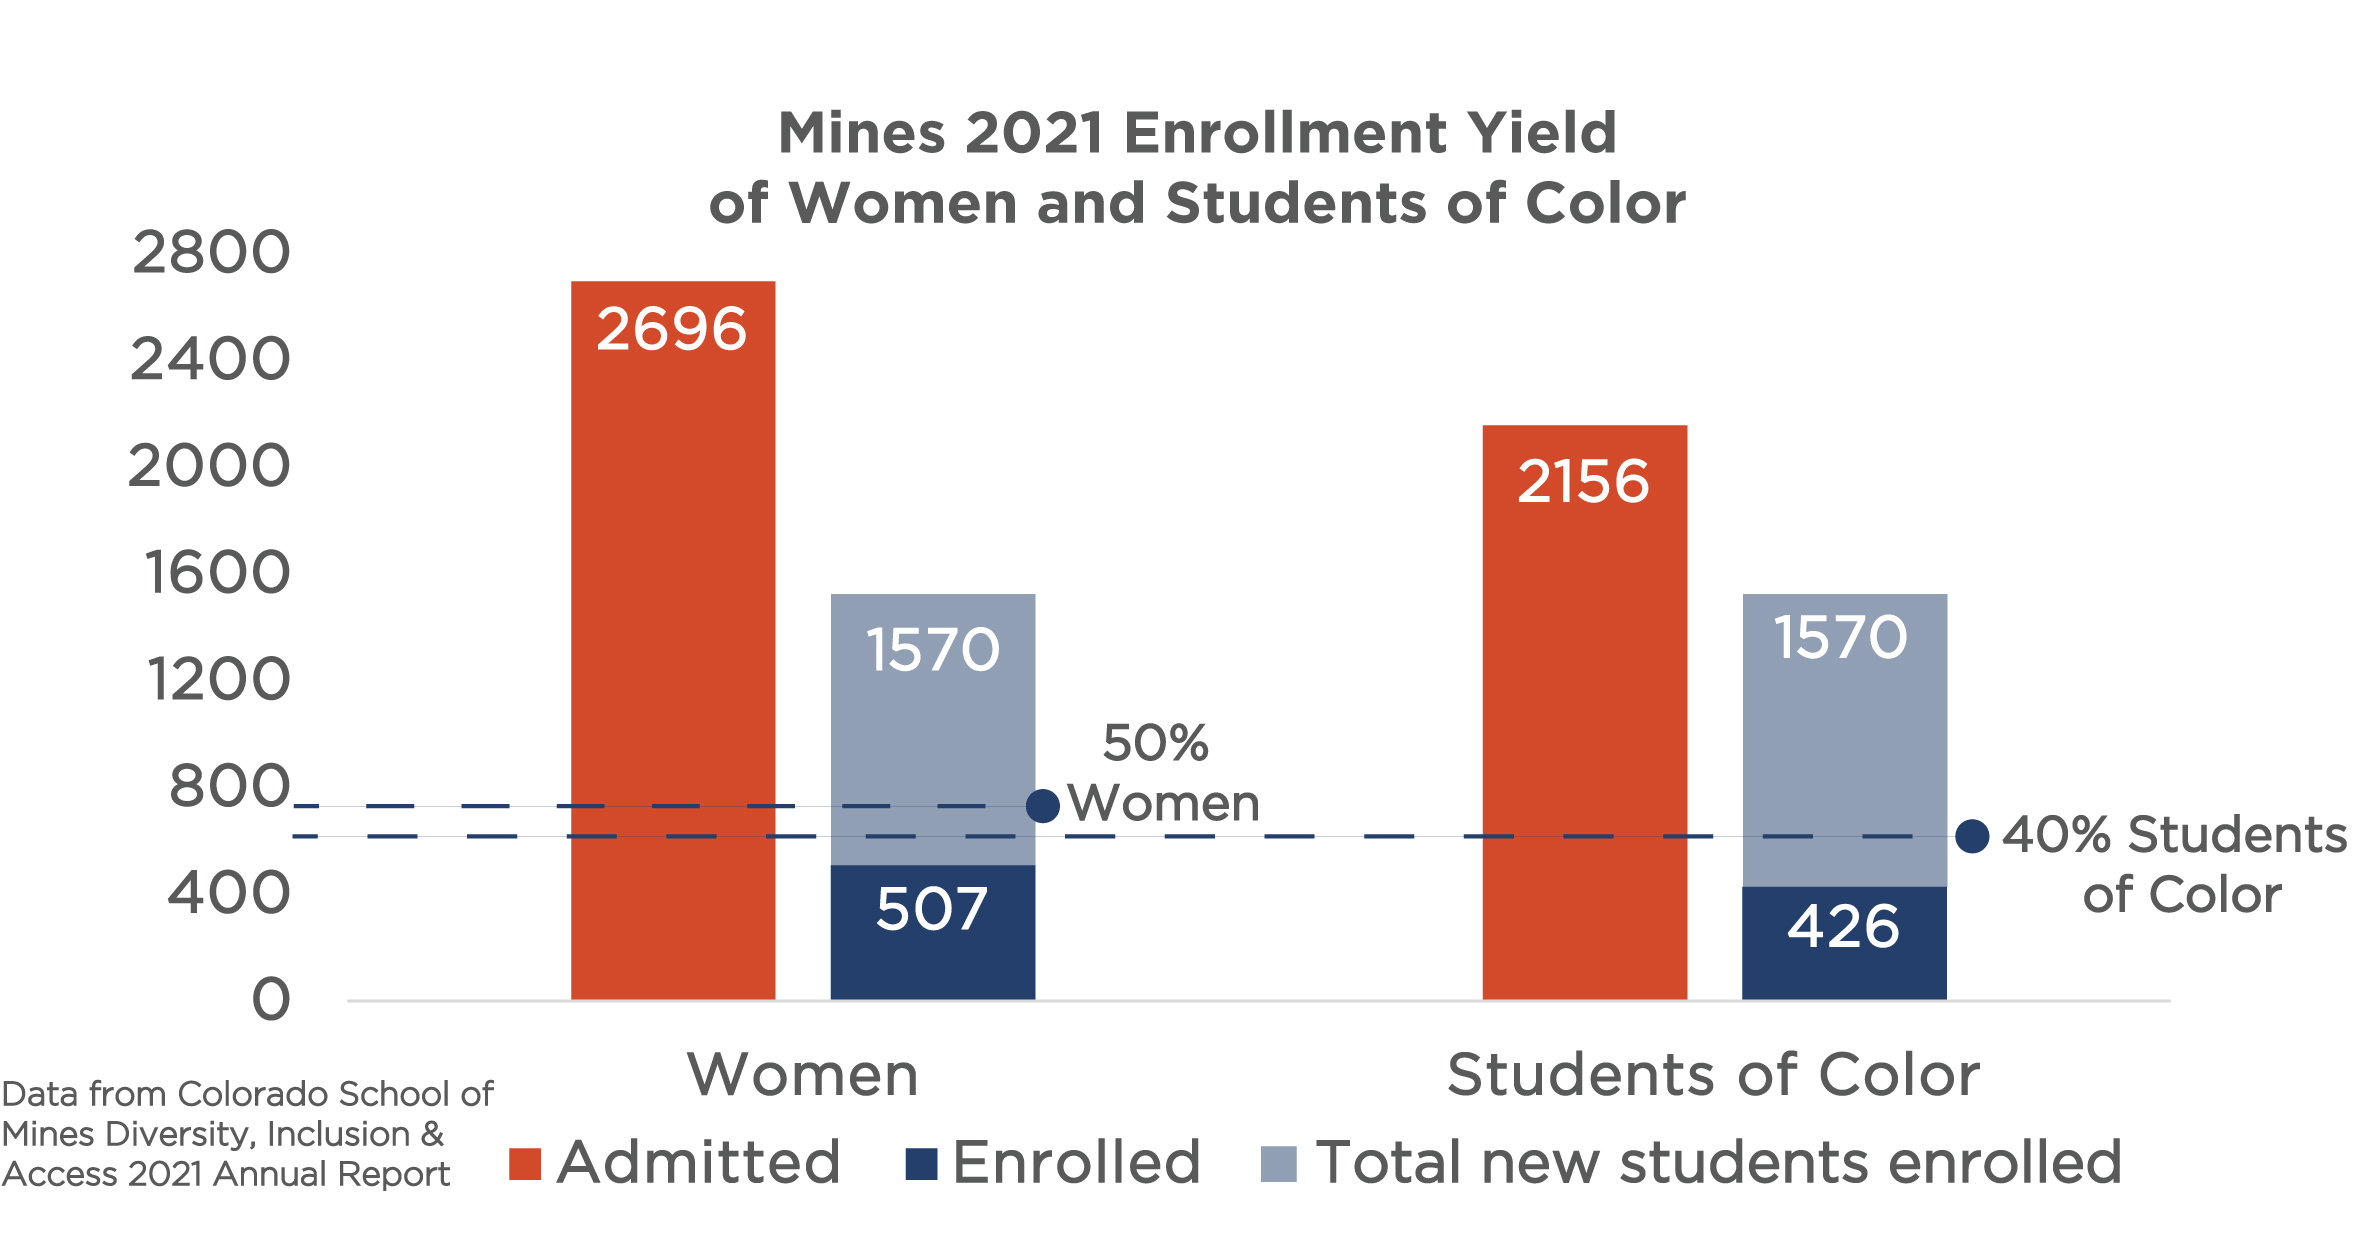 Click on graph image to view larger size Click on graph image to view larger size |
| This graph represents the number and proportion of first-year and transfer undergraduate students who applied to Mines, were admitted into Mines and who enrolled at Mines for the fall of 2021. This “admissions pipeline” describes a big-picture story of admissions trends in 2021 by gender. Gender is defined here as only either male or female due to limitations in data collection and reporting. | 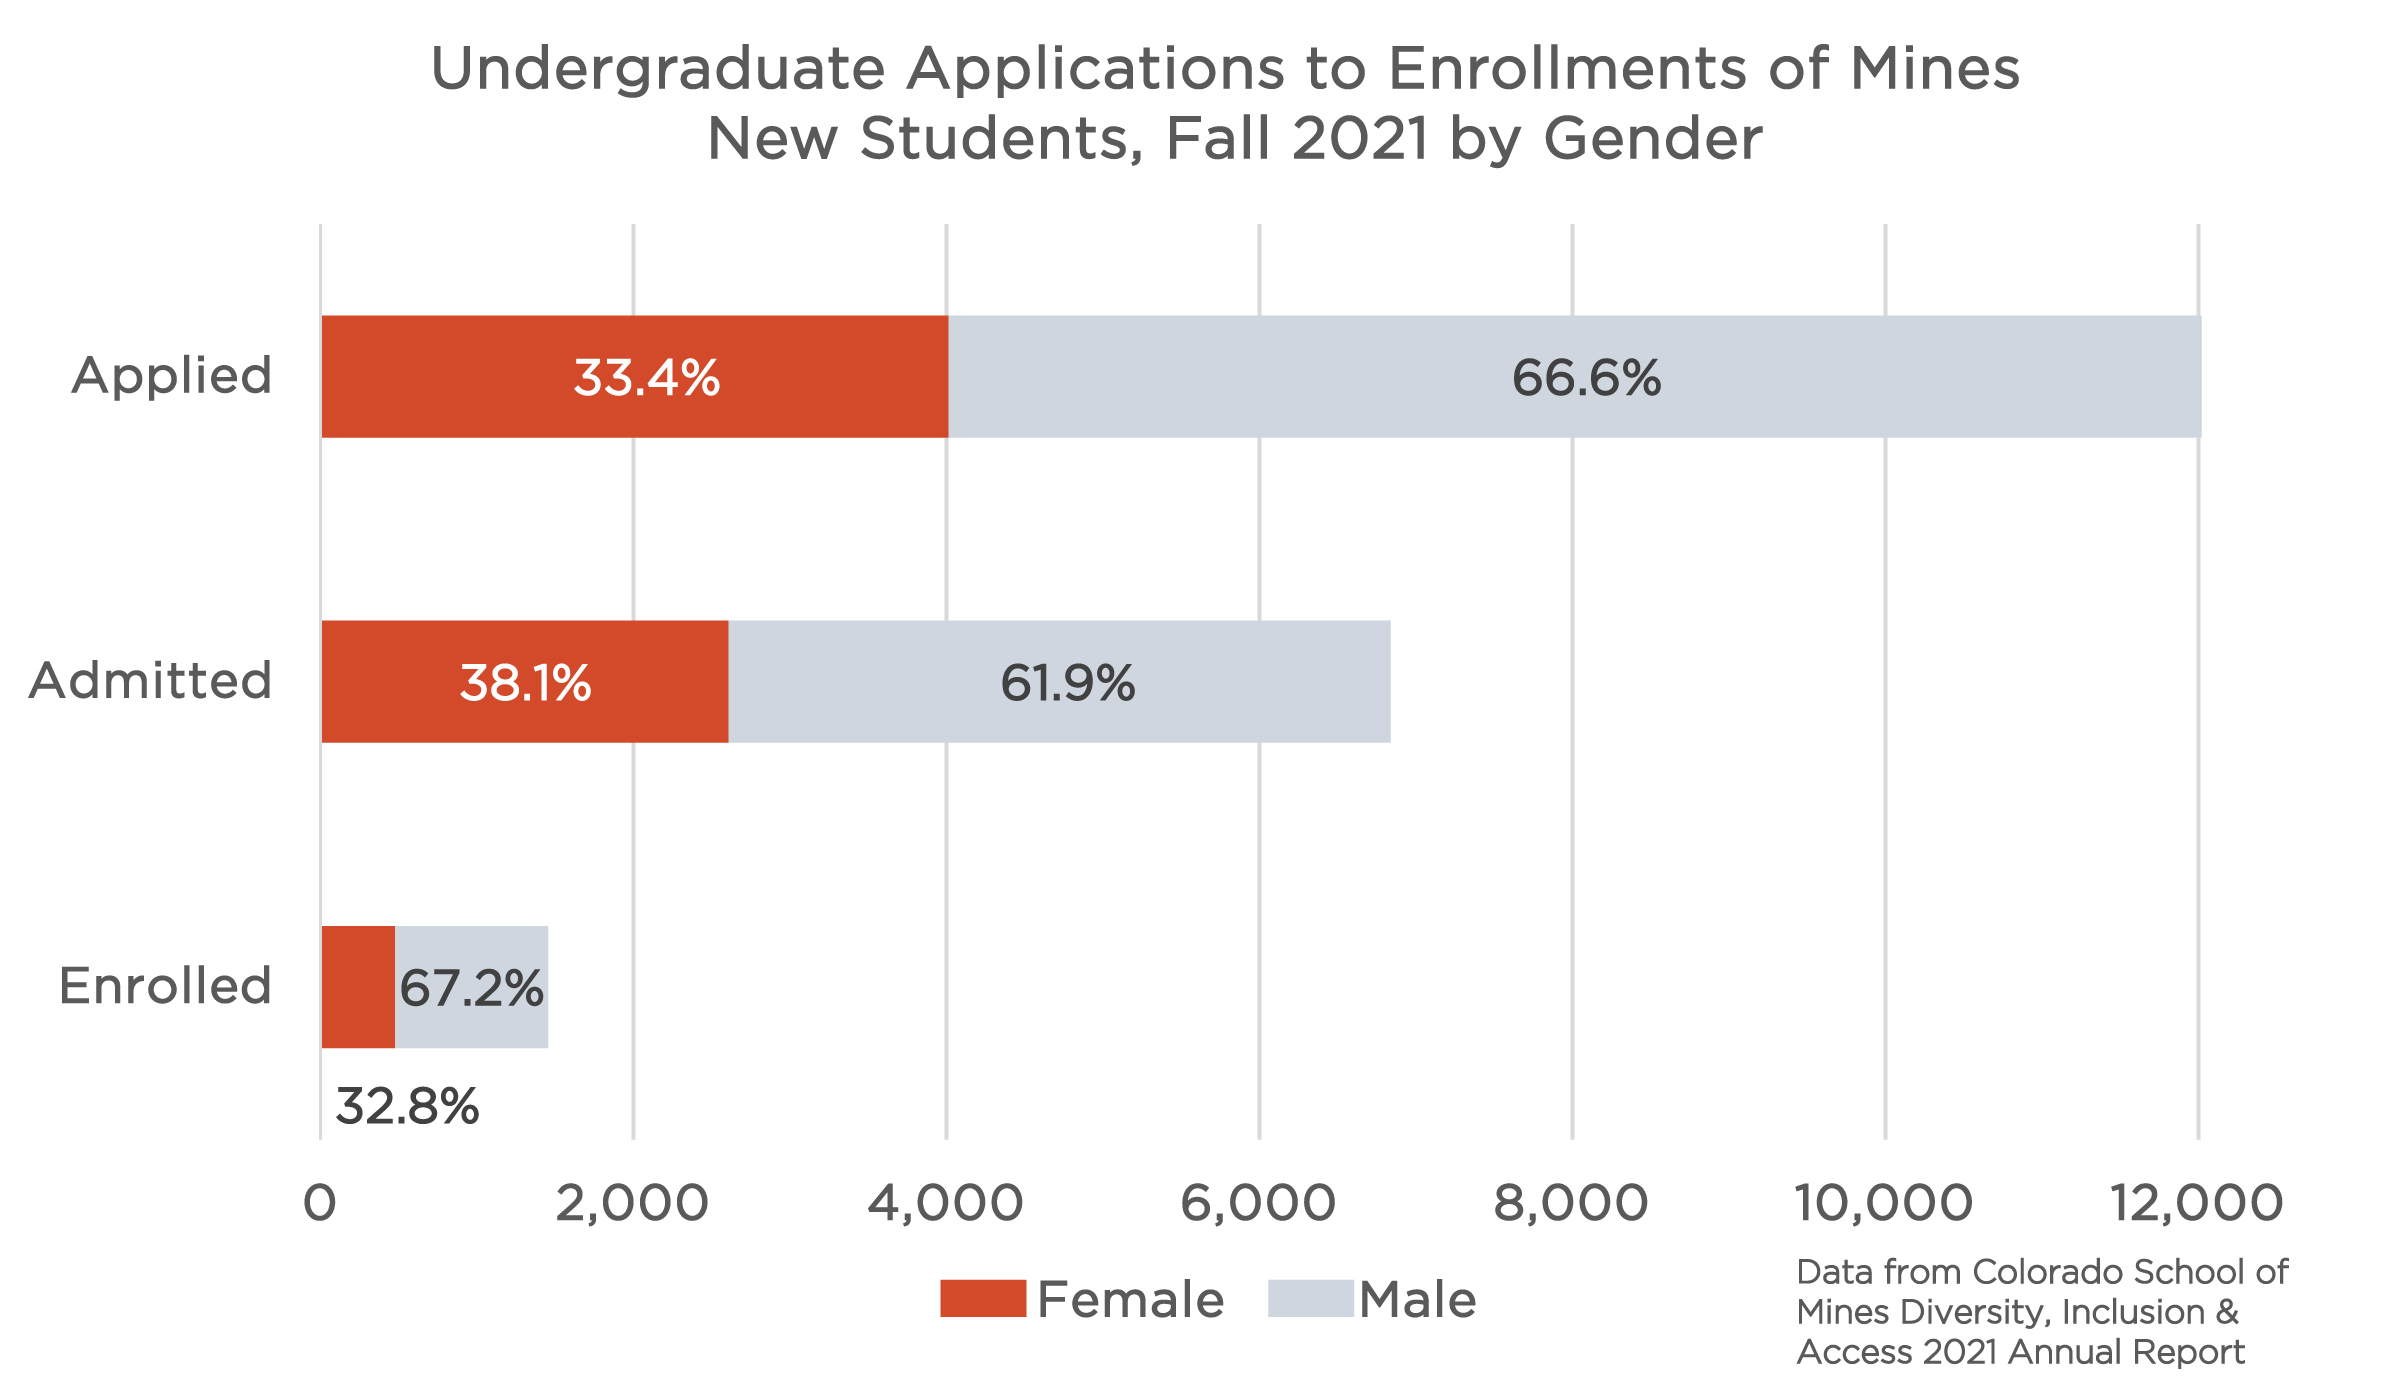 Click on graph image to view larger size Click on graph image to view larger size |
| Similar to the admissions pipeline showing the gender breakdowns of Mines incoming 2021 class, this graph shows the number and proportion of first-year and transfer undergraduate students by race and ethnicity. This admissions pipeline describes a big-picture story of admissions trends in 2021 by detailing the number and proportion of undergraduate students who applied to Mines, were admitted into Mines and who enrolled at Mines. We define URG as those who identify as American Indian/Alaskan Native, African American/Black, Asian, Hispanic/Latinx, multiple races and Native Hawaiian/Pacific Islander. | 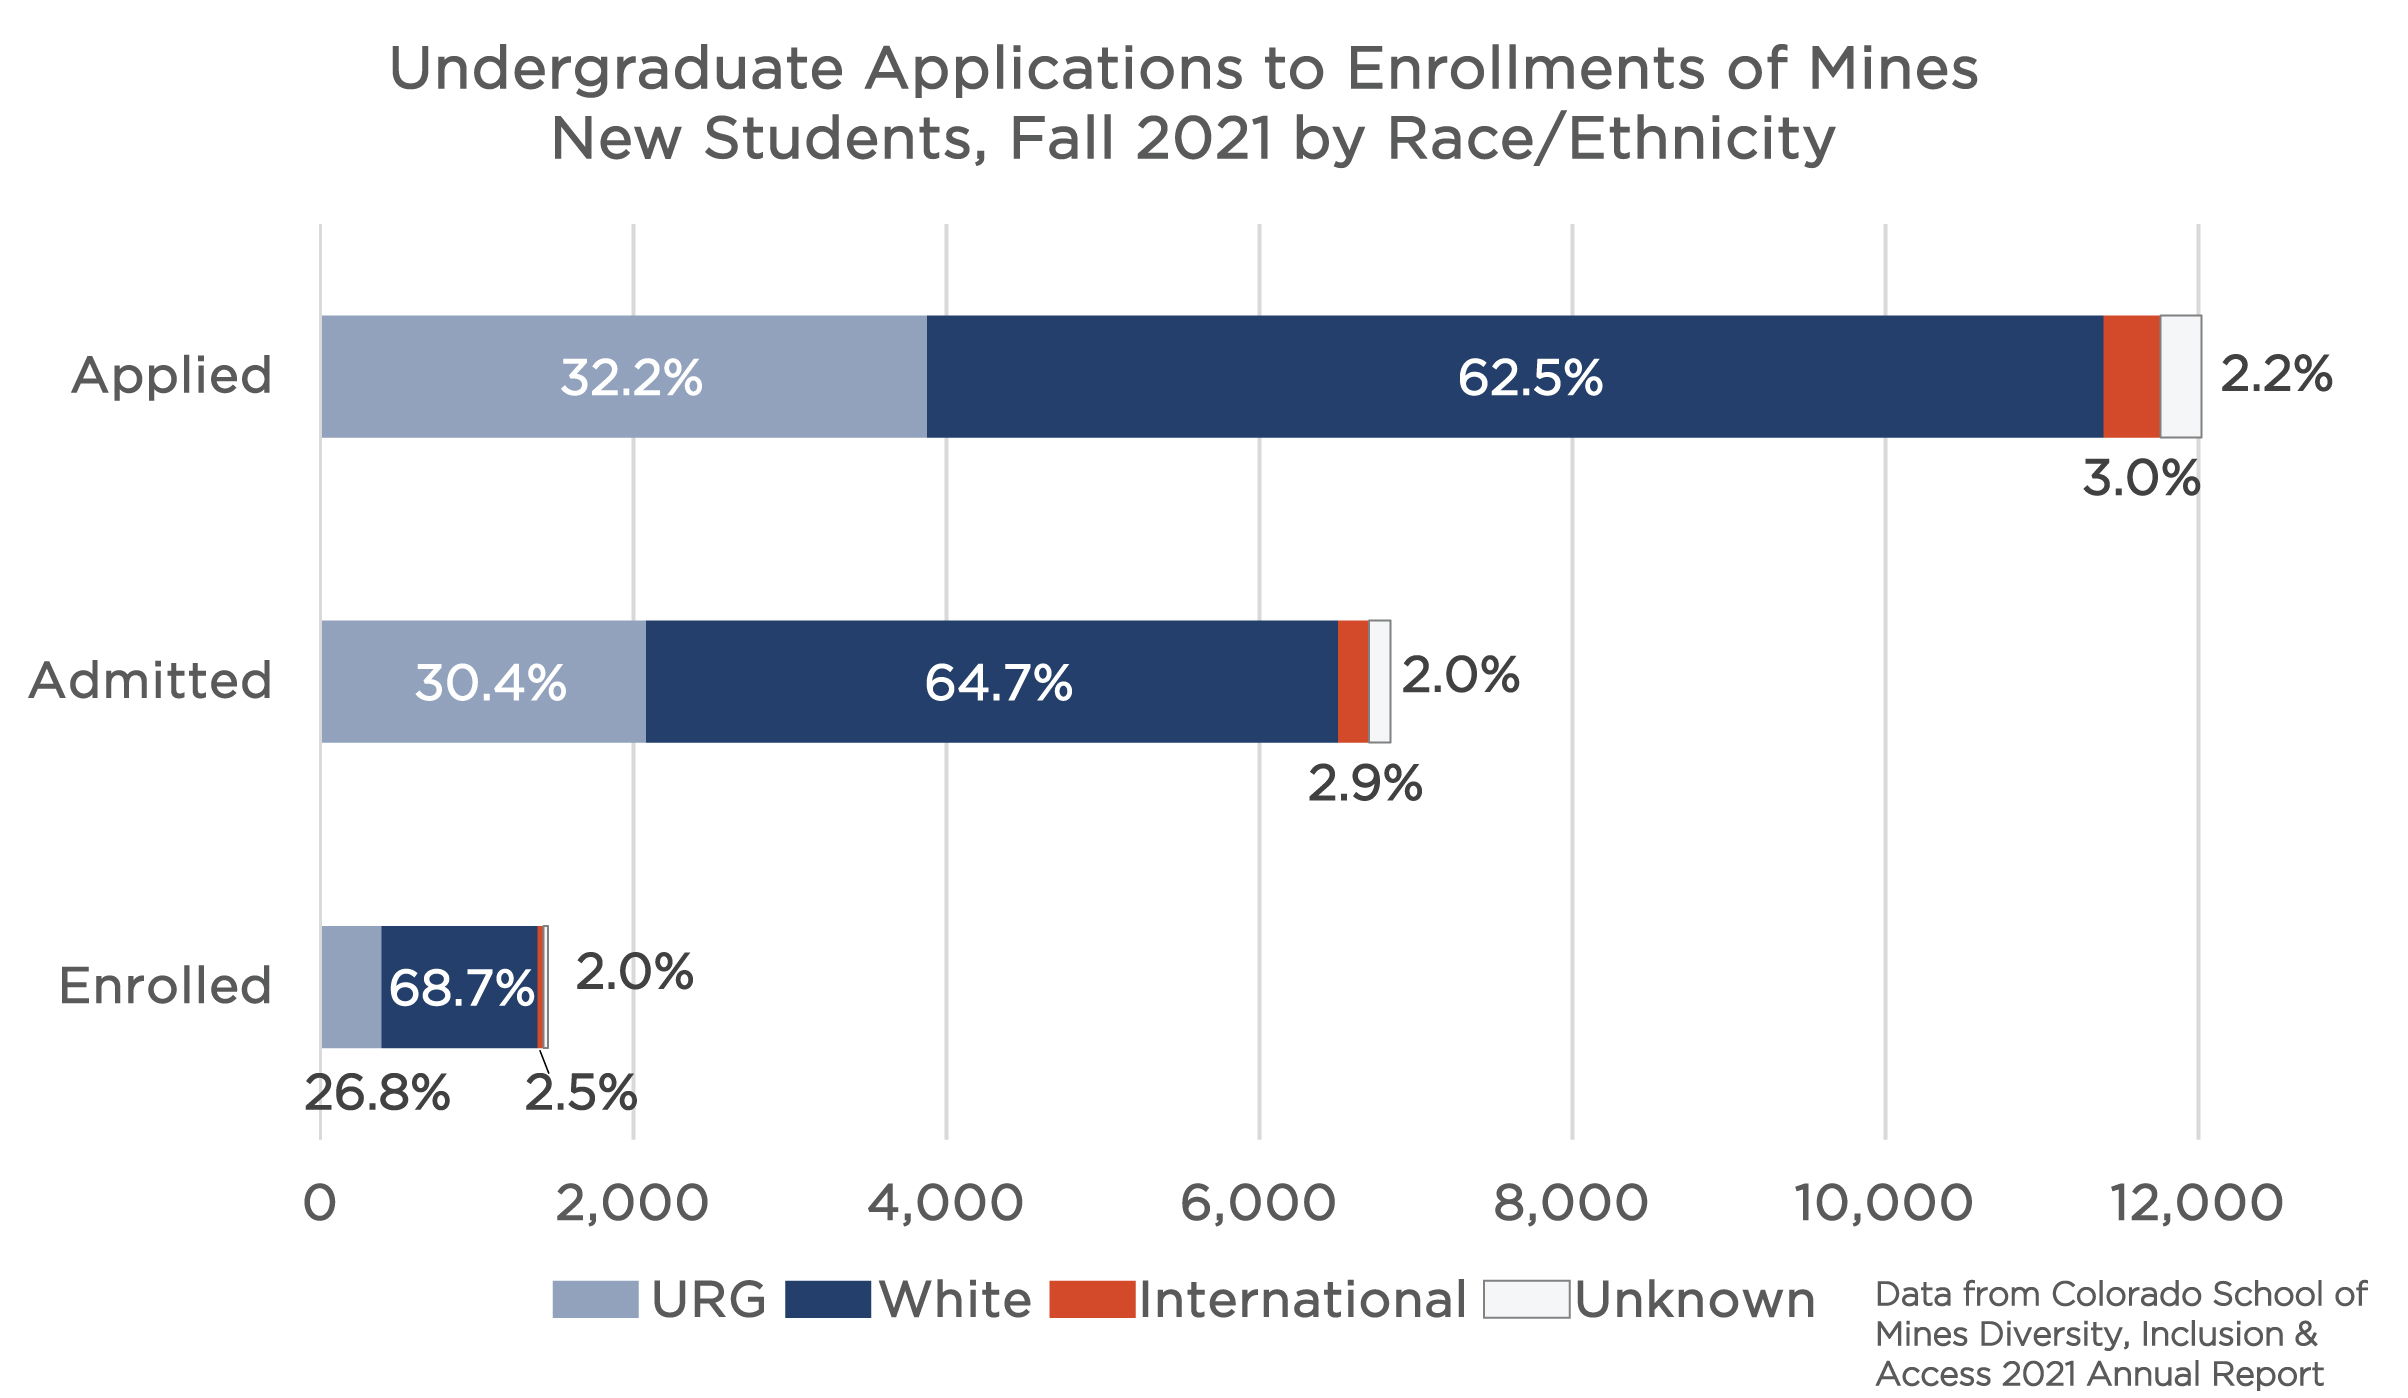 Click on graph image to view larger size Click on graph image to view larger size |
|
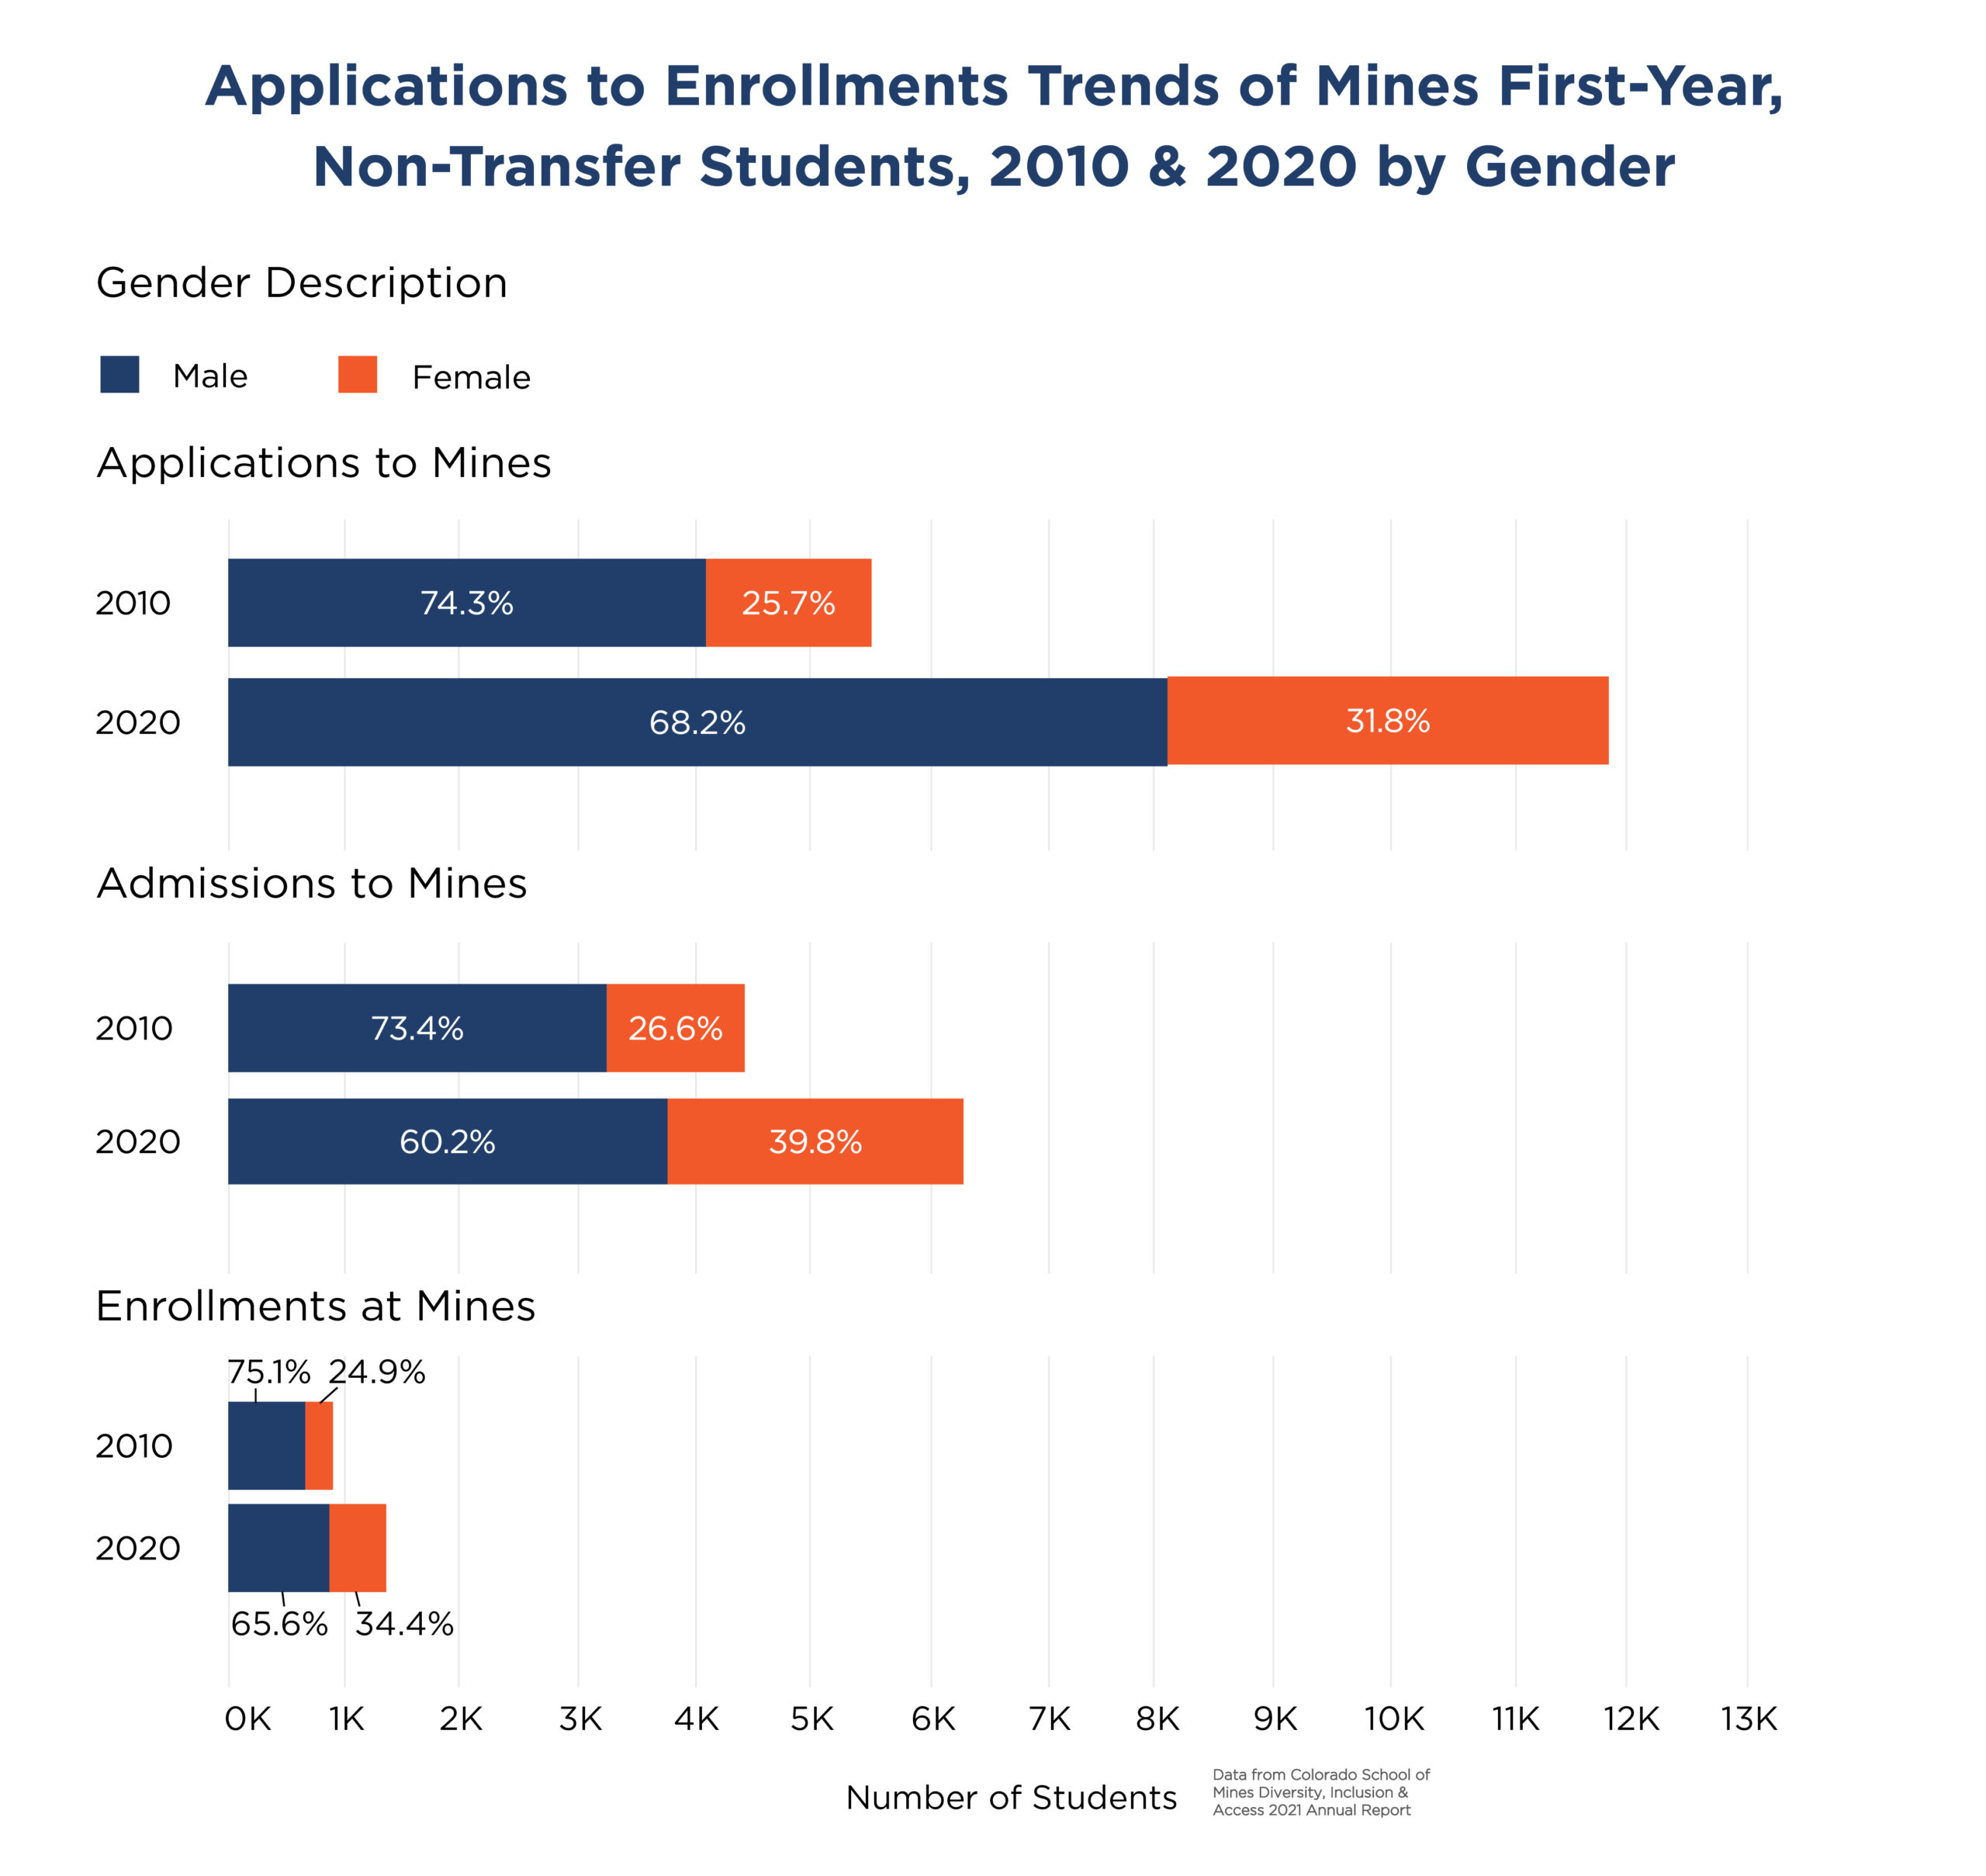
Depiction of the applications to enrollments funnel of first-year, non-transfer students at Mines compared between 2010 and 2020. Each bar shows the percentages of females and males within a total number of students who applied to Mines, were admitted to Mines and who enrolled at Mines. These data are broken down by race and ethnicity, where underrepresented groups (URGs) include: American Indian/Alaskan Native, Black/African American, Hispanic, Multiple Races and Native Hawaiian/ Pacific Islander. We observe over the past decade, representation of URGs has greatly increased in all portions of the funnel, not only in percentages but also in absolute numbers, as indicated by the x-axis. Gender is defined here as only either male or female due to limitations in data collection and reporting. Read more about undergraduate enrollment trends by gender in the 2020 Annual Report |
 Click on graph image to view larger size Click on graph image to view larger size |
|
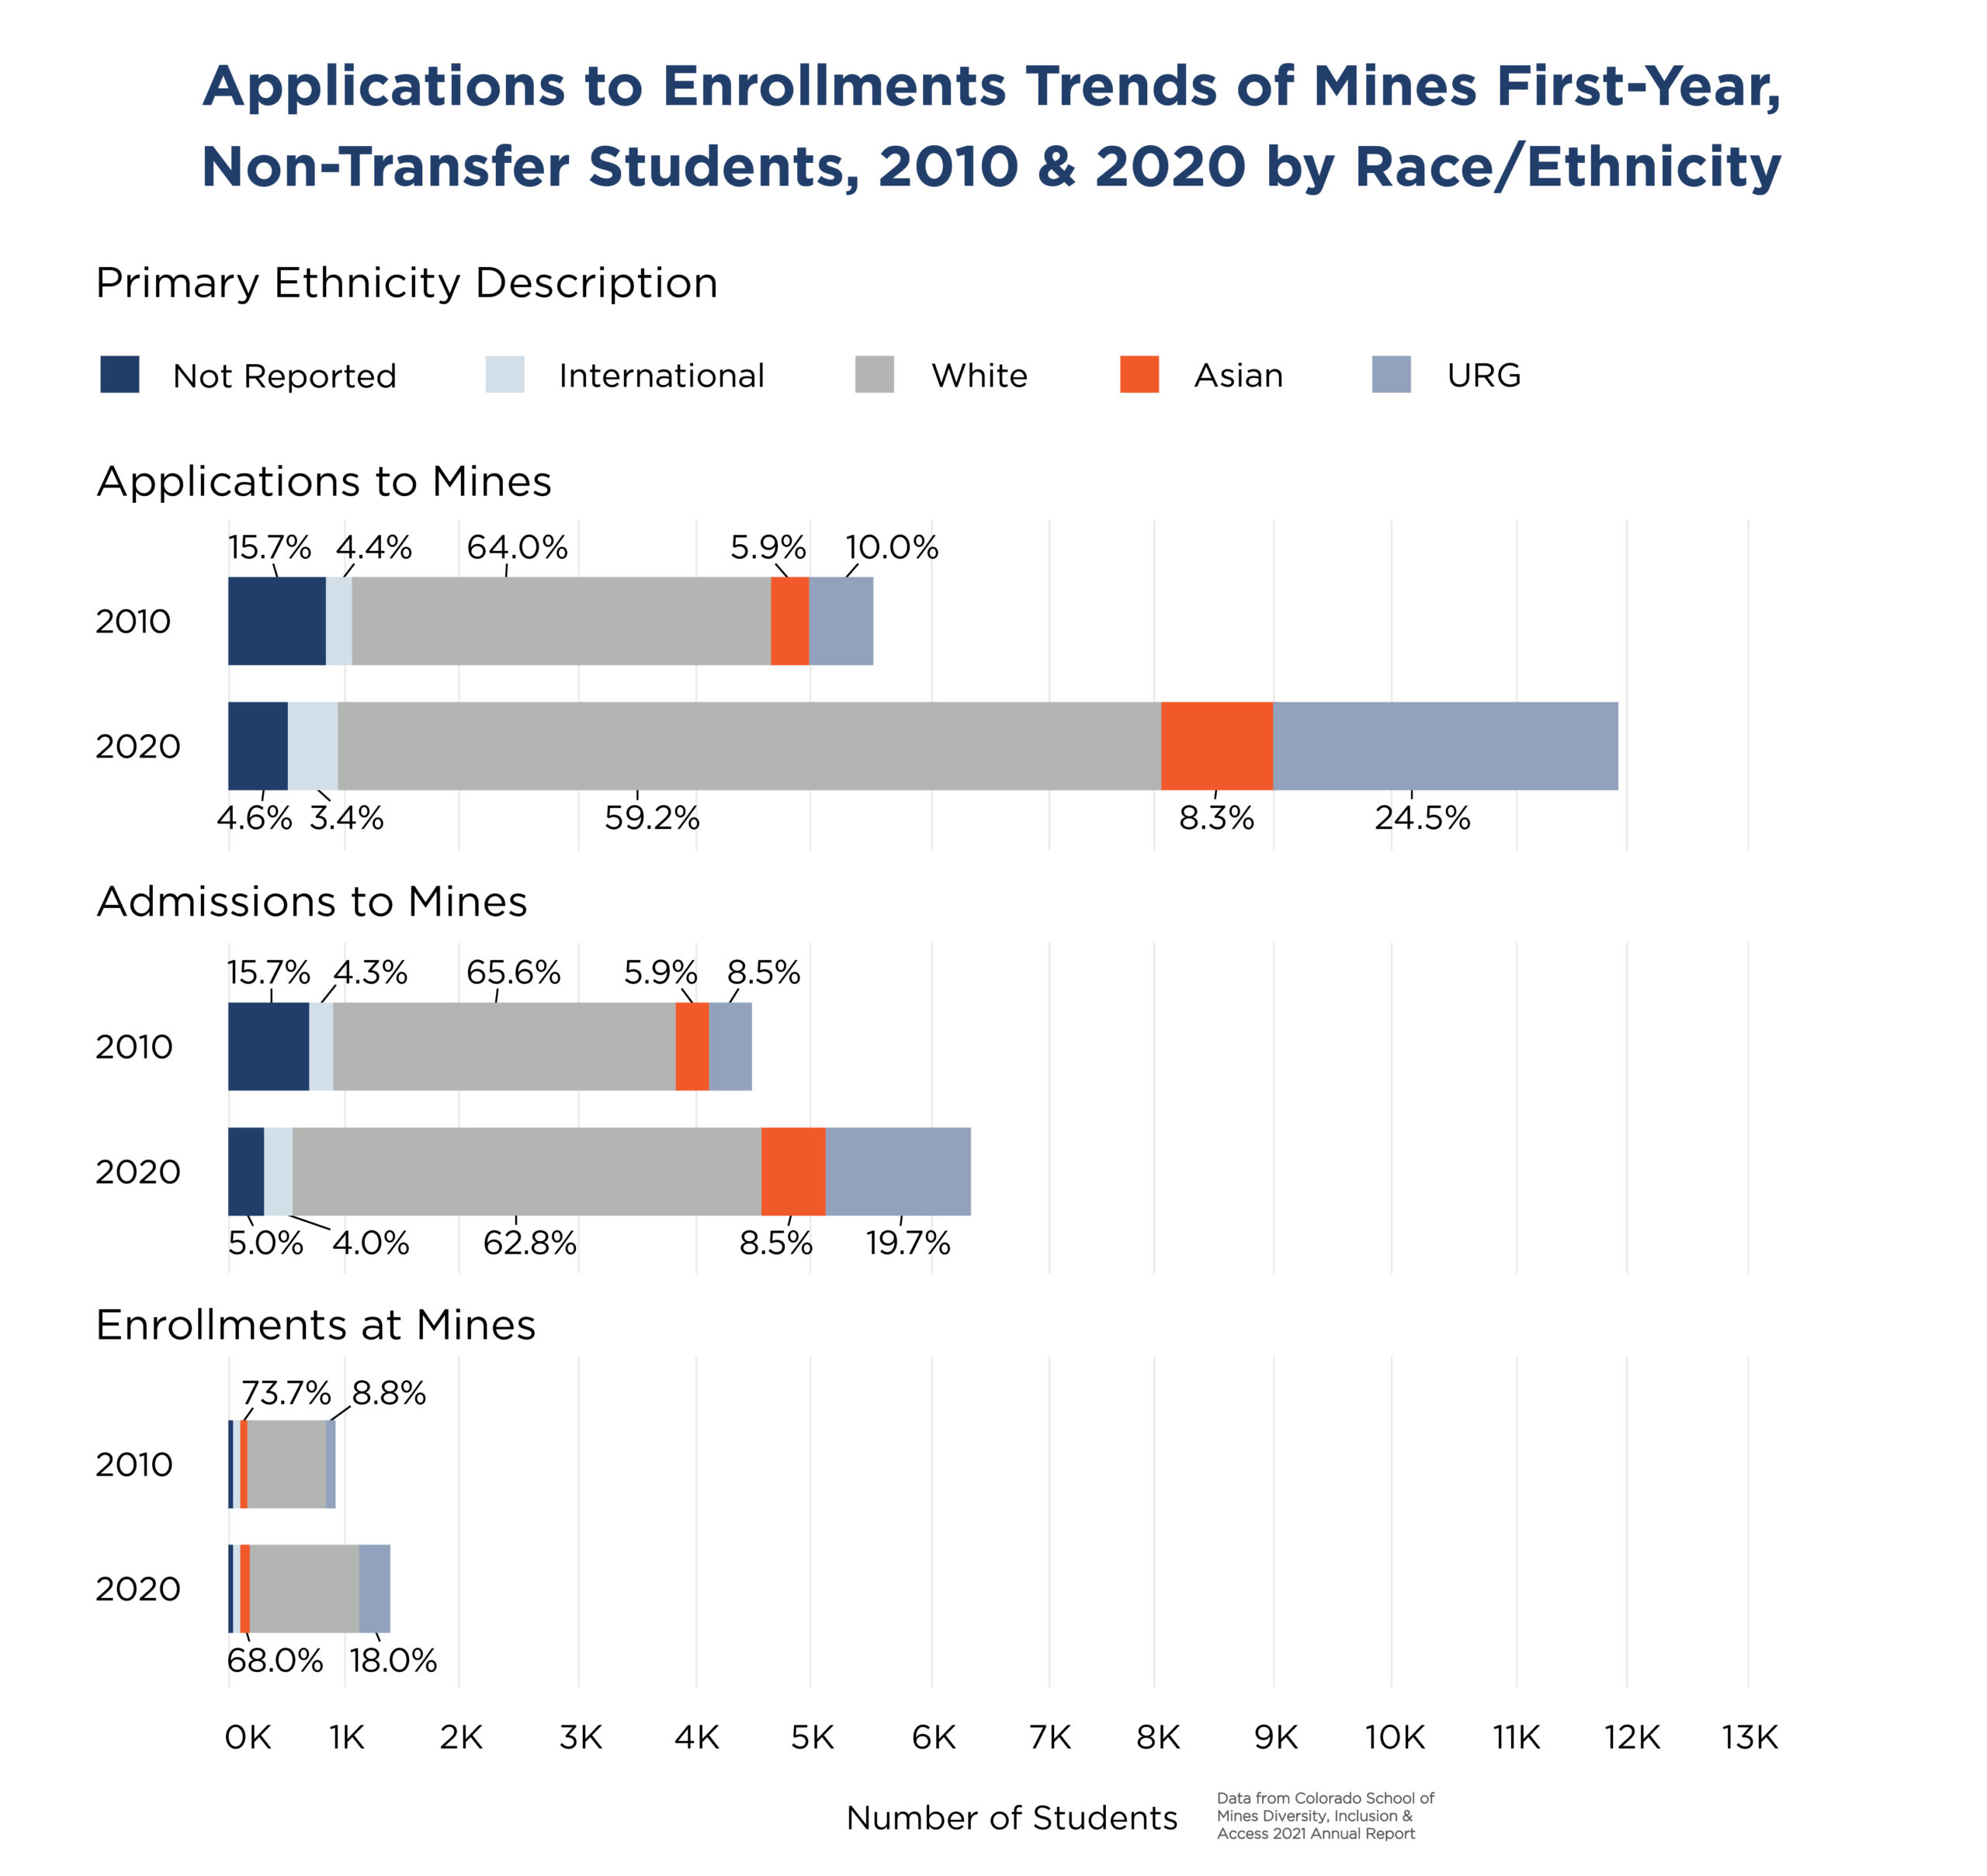
Depiction of the applications to enrollments funnel of first-year, non-transfer students at Mines compared between 2010 and 2020. Each bar shows the percentages of these demographics within a total number of students who applied to Mines, were admitted to Mines and who enrolled at Mines. These data are broken down by gender. Similar to the race/ethnicity funnel, we see that representation of female students has increased in the past decade both proportionally and in absolute numbers, as indicated on the x-axis. Read more about undergraduate enrollment trends by race/ethnicity in the 2020 Annual Report |
 Click on graph image to view larger size |
Other Enrollment Trends of Undergraduate Students
| Mines’ fall 2021 in-state enrollments highly contributed to increasing the representation of historically underrepresented and marginalized groups at Mines in our Science, Technology, Engineering and Mathematics (STEM) disciplines. Mines’ in-state enrollments of first-year undergraduate students boasted a high proportion of female students (35%) compared to the overall undergraduate (including transfer students) enrollments (32.8%). Furthermore, the proportion of racial and ethnic marginalized in-state students were 34.0% of the incoming first-year class, whereas they were 26.8% of the total new students coming to Mines in fall 2021. We define URG as those who identify as American Indian/Alaskan Native, African American/Black, Asian, Hispanic/Latinx, multiple races and Native Hawaiian/Pacific Islander. Gender is defined here as only either male or female due to limitations in data collection and reporting. | 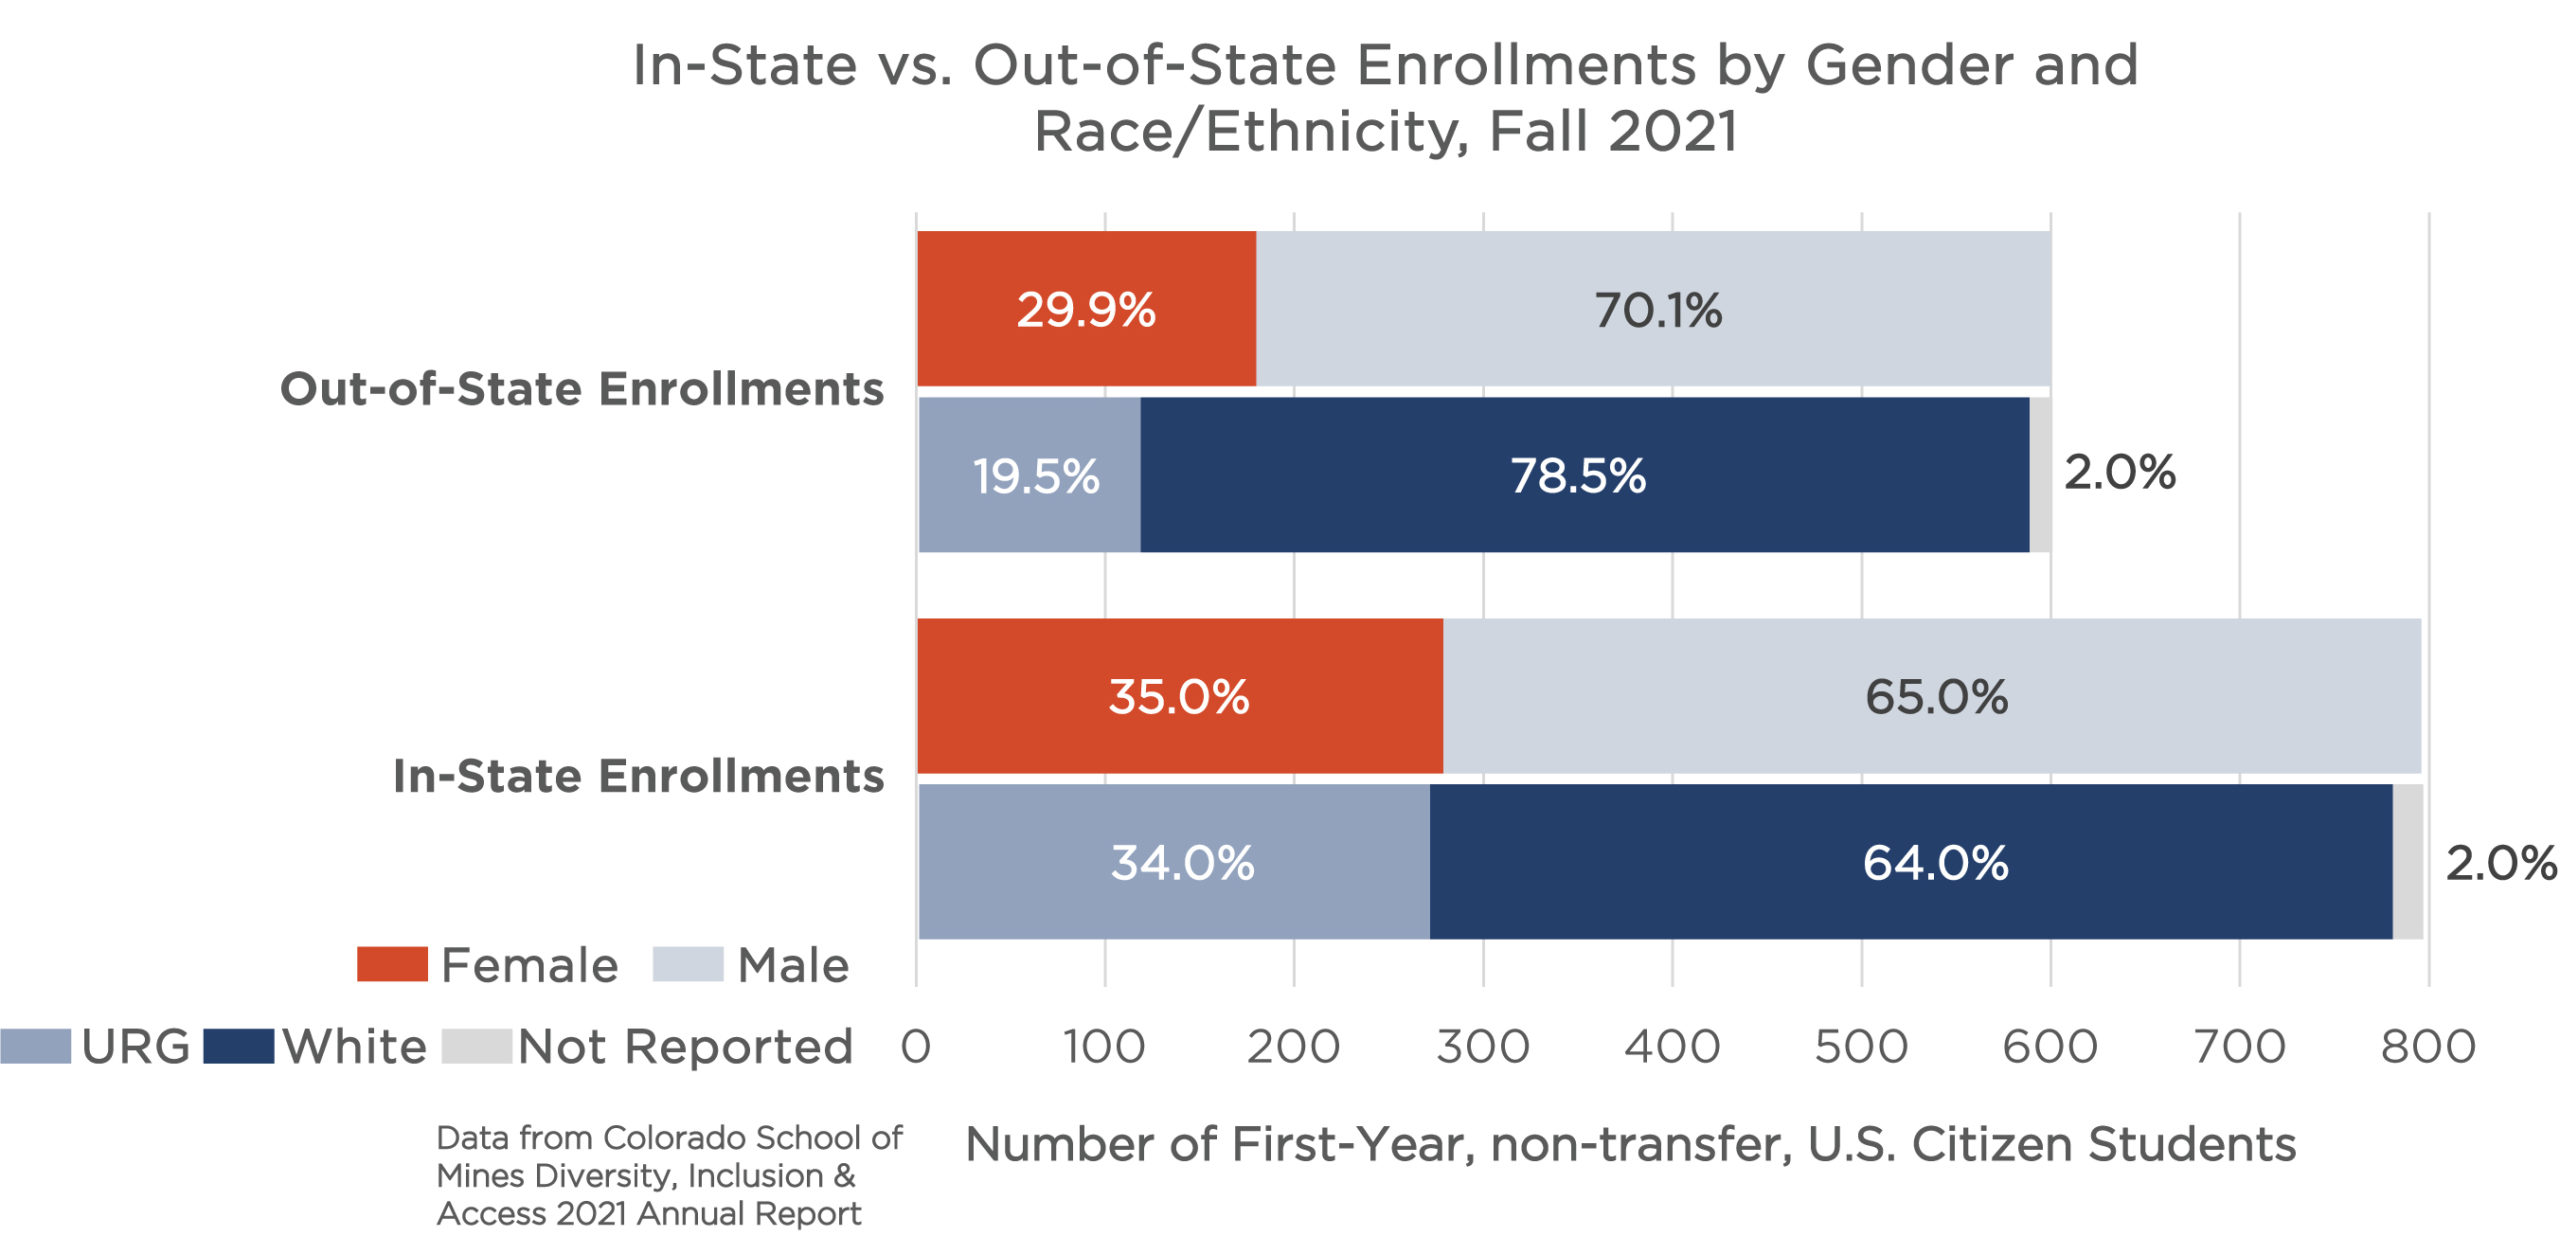 Click on graph image to view larger size Click on graph image to view larger size |
|
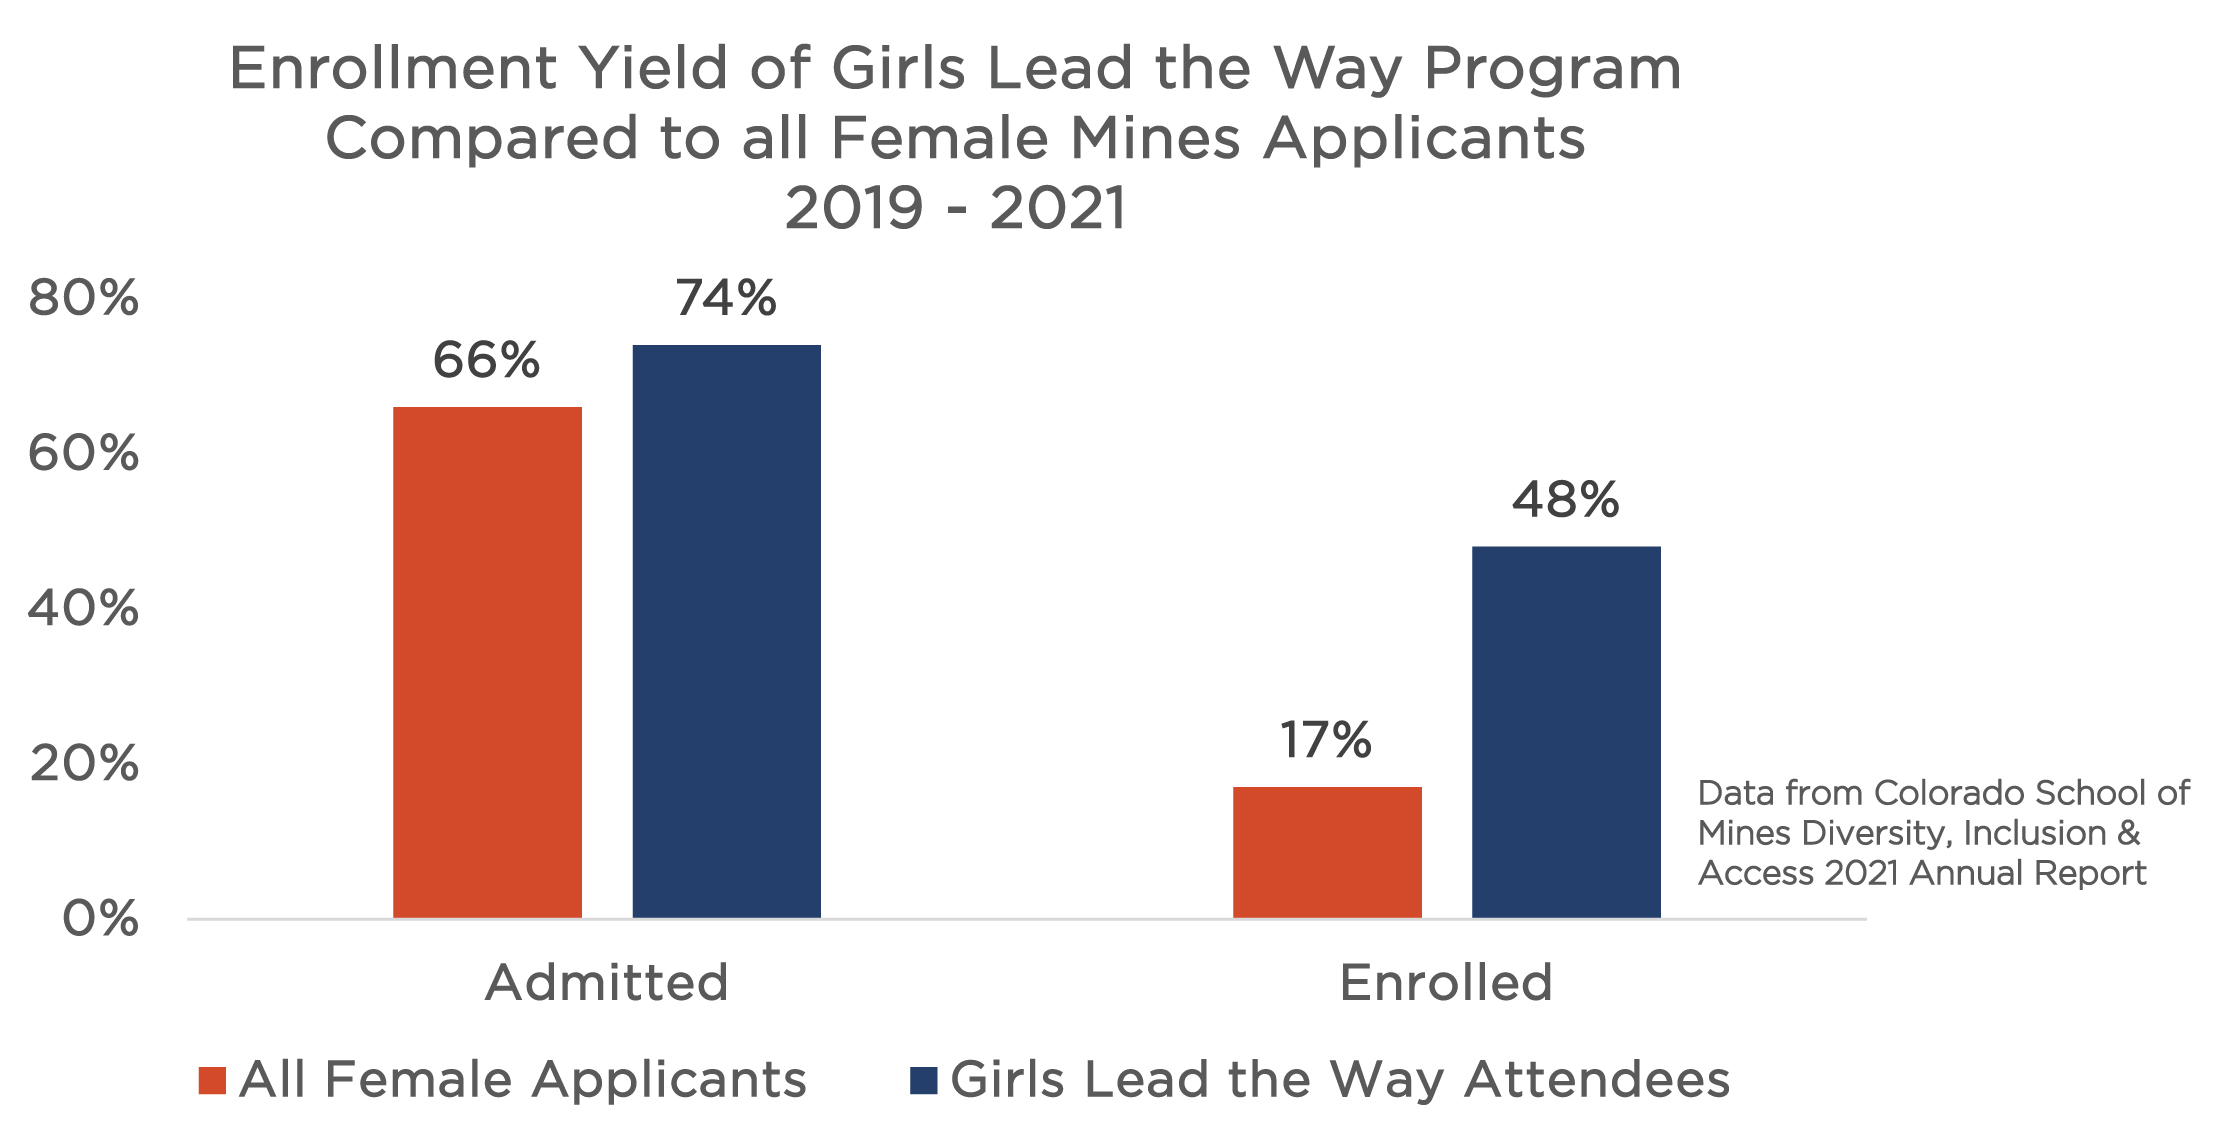
Mines’ Society of Women Engineers (SWE) holds an annual conference called Girls Lead the Way. It is a full day of interactive, lab or classroom-based learning designed to introduce high school girls in grades 9-12 to engineering and applied mathematics concepts and the Mines campus. Between 2019 and 2021, the enrollment of female students who attended the Girls Lead the Way program had higher admitted and enrollment rates compared to the general female population who applied to Mines. From 2019 to 2021, there were a total of 8,042 women who were admitted to Mines and 1,393 who enrolled at Mines – a rate of 66% and 17%, respectively. By comparison, for female students who attended “Girls Lead the Way,” there were 95 admitted into Mines and 46 of them enrolled, yielding a 74% and 48% admitted and enrollment yields, respectively. |
 Click on graph image to view larger size Click on graph image to view larger size |
Financially Accessible and Attractive to Students with Diverse Backgrounds
It has become critically important for students and their families to assess the return on investment of a college education in comparison to the types of jobs and career pathways available to students upon graduation. Comparing the potential debt students may incur to an annual salary they earn is important when considering how accessible and attractive an institution may be. At Mines, our students enjoy very high job placement rates with competitive salaries. Here we’ll discuss some of the data and resources we have to reduce student debt at Mines.
In fall 2020, to provide the financial support to students, Mines provided $31.5 million of university resources for financial aid. This increased to $35 million in 2021. In addition, there was $7 million in scholarships funded by the Colorado School of Mines Foundation in 2020, which increased to $7.6 million in 2021.
For more information about scholarships at Mines, visit the Scholarship Information in the Financial Aid website. In addition, if you’d like to explore what the Harvey Scholarship program has to offer, find more information on their webpage. As part of Mines’ signature experience of creating vertically integrated Communities of Scholars, find more information about the Vanguard Scholarship program on their webpage.
Below is the average undergraduate loan debt for 2020-2021:
- Loan Debt by Race/Ethnicity and First-Generation
- Loan Debt by Residency, Student Population and Gender
|
This graph represents the average amount of personal loan debt undergraduate borrowers incurred from 2020 – 2021 at the time of graduation. It’s important to note when considering these data that Mines has a cohort default rate of only 0.7% compared to the national average default rate of 7.3%. The amount of debt is broken down by race/ethnicity and first-generation status. We define a first-generation student as someone who is the first in their family, other than siblings, to attend college. Some data were omitted due to a small sample number. Overall, the number of students in marginalized groups are considerably smaller than the number of white students and thus their average debt amounts may be impacted by a smaller sample. In comparison, median starting salaries of Mines Bachelor’s degree recipients ranged from $57,000 per year to $80,000 per year. In 2020, the average starting salary for all Bachelor’s, Master’s and PhD degree recipients was $79,000 per year. With these kinds of starting salaries, Mines graduates are set up for success to reduce the debt they incurred while in school. |
 Click on graph image to view larger size Click on graph image to view larger size |
| This graph shows the differences in average loan debt for undergraduate students by residency, student population (first-years vs. transfers) and gender. Unsurprisingly, out-of-state students incur on average more debt than Colorado residents. Furthermore, transfer students also incur more debt than their first-year counterparts. Transfer students nation-wide tend to incur more loan debt compared to first-year, non-transfer students; this trend is not isolated to Mines transfer populations. As shown in the red vs. silver colors on the bar graph, female students tend to incur slightly more debt on average than male students, with a more notable difference for transfer student populations. Gender is defined here as only either male or female due to limitations in data collection and reporting. |  Click on graph image to view larger size Click on graph image to view larger size |
Unlike undergraduate admissions processes, graduate admissions processes are not conducted by one office, but rather by a combination of offices, including the Admissions Office and individual departments. Each program has admissions committees who make decisions for Master’s of Science (thesis) and PhD programs based on their unique requirements. Master’s non-thesis and certificate programs are decided by the Admissions Office.
Mines faculty are committed to broadening participation and increasing representation at Mines’ graduate programs. For example, Dr. Lincoln Carr landed a $2.3 million grant from the National Science Foundation to develop rigorous, integrated, interdisciplinary training programs preparing both Master’s and Doctoral students for careers in quantum information science and technology (QIST). A collaboration between Mines and San Jose State University (SJSU), the team developed a Memorandum of Agreement (MOA) between Mines and SJSU that will provide opportunities for students to complete an MS/Ph.D. bridge program from SJSU to Mines. SJSU is a Minority Serving Institution (MSI) and so collaboration will help to increase the diversity of the QIST workforce. In addition, the team will develop a template for quantum engineering graduate programs that can be implemented at any institution, helping to increase the diversity of the field, since most of these programs are primarily at Ivy League institutions. For more information about the QIST project, check out the Mines Newsroom press release.
Another project working to broaden participation in graduate programs is the Humanitarian Engineering and Science Ambassadors (HESA) led by Dr. Kevin Moore. The $1.4 million project called, “Humanitarian Engineering and Science Ambassadors (HESA): Leveraging Funds of Knowledge for Student Success” will provide scholarships and mentoring opportunities to low-income graduate students whose thesis research or non-thesis practicum combines a disciplinary specialty in environmental engineering, geological engineering or geophysics and others, with social scientific coursework in sustainable community development. The role of students’ “funds of knowledge” in their academic success will be investigated. This project is funded by NSF’s Scholarships in Science, Technology, Engineering and Mathematics program, which seeks to increase the number of low-income academically talented students with demonstrated financial need who earn degrees in STEM fields. This project will provide scholarships to at least 43 unique graduate HES students from low-income backgrounds. Students from these backgrounds are more likely to have marginalized identities and bring lived experiences that will enrich the program. To learn more about the Humanitarian Engineering and Science Ambassador program, check out the Mines Newsroom press release.
Graduate Pipeline
To understand the larger picture of graduate recruitment trends at Mines, investigating the whole admissions “pipeline” from the application stage to the enrollment stage helps determine who applies versus who ends up enrolling at Mines to learn if there are changes in demographic proportions throughout the pipeline. A major difference between undergraduate admissions and graduate admissions is that, proportionally, more graduate students tend to submit more than one application to Mines, hoping to get into more than one program. Because of this, there are differences in how we analyze the data, either by using the “applicant, admitted and enrolled” data or by using the “number of applications, number of applications admitted and number of applications enrolled” data. The differences in proportions are small (usually around 0.2%), but still meaningful. For the purposes of the DI&A Annual Report, we want to use the data that counts the number of individual people, not how many applications they submit.
| This graph shows the number of applicants, students admitted and students enrolled at Mines for non-thesis graduate programs in fall 2021, broken down by gender. There is little difference between the proportion of female identifying students who applied, were admitted and who enrolled, which is a positive outcome. Overall, there are still more male identifying students compared to female identifying students. These data only include new, incoming non-thesis graduate students and includes both residential (in-person) and online programs. The data include all degrees, except “null.” Non-thesis programs include Master’s non-thesis, graduate certificates and post-baccalaureate certificates. Gender is defined here as only either male or female due to limitations in data collection and reporting. | 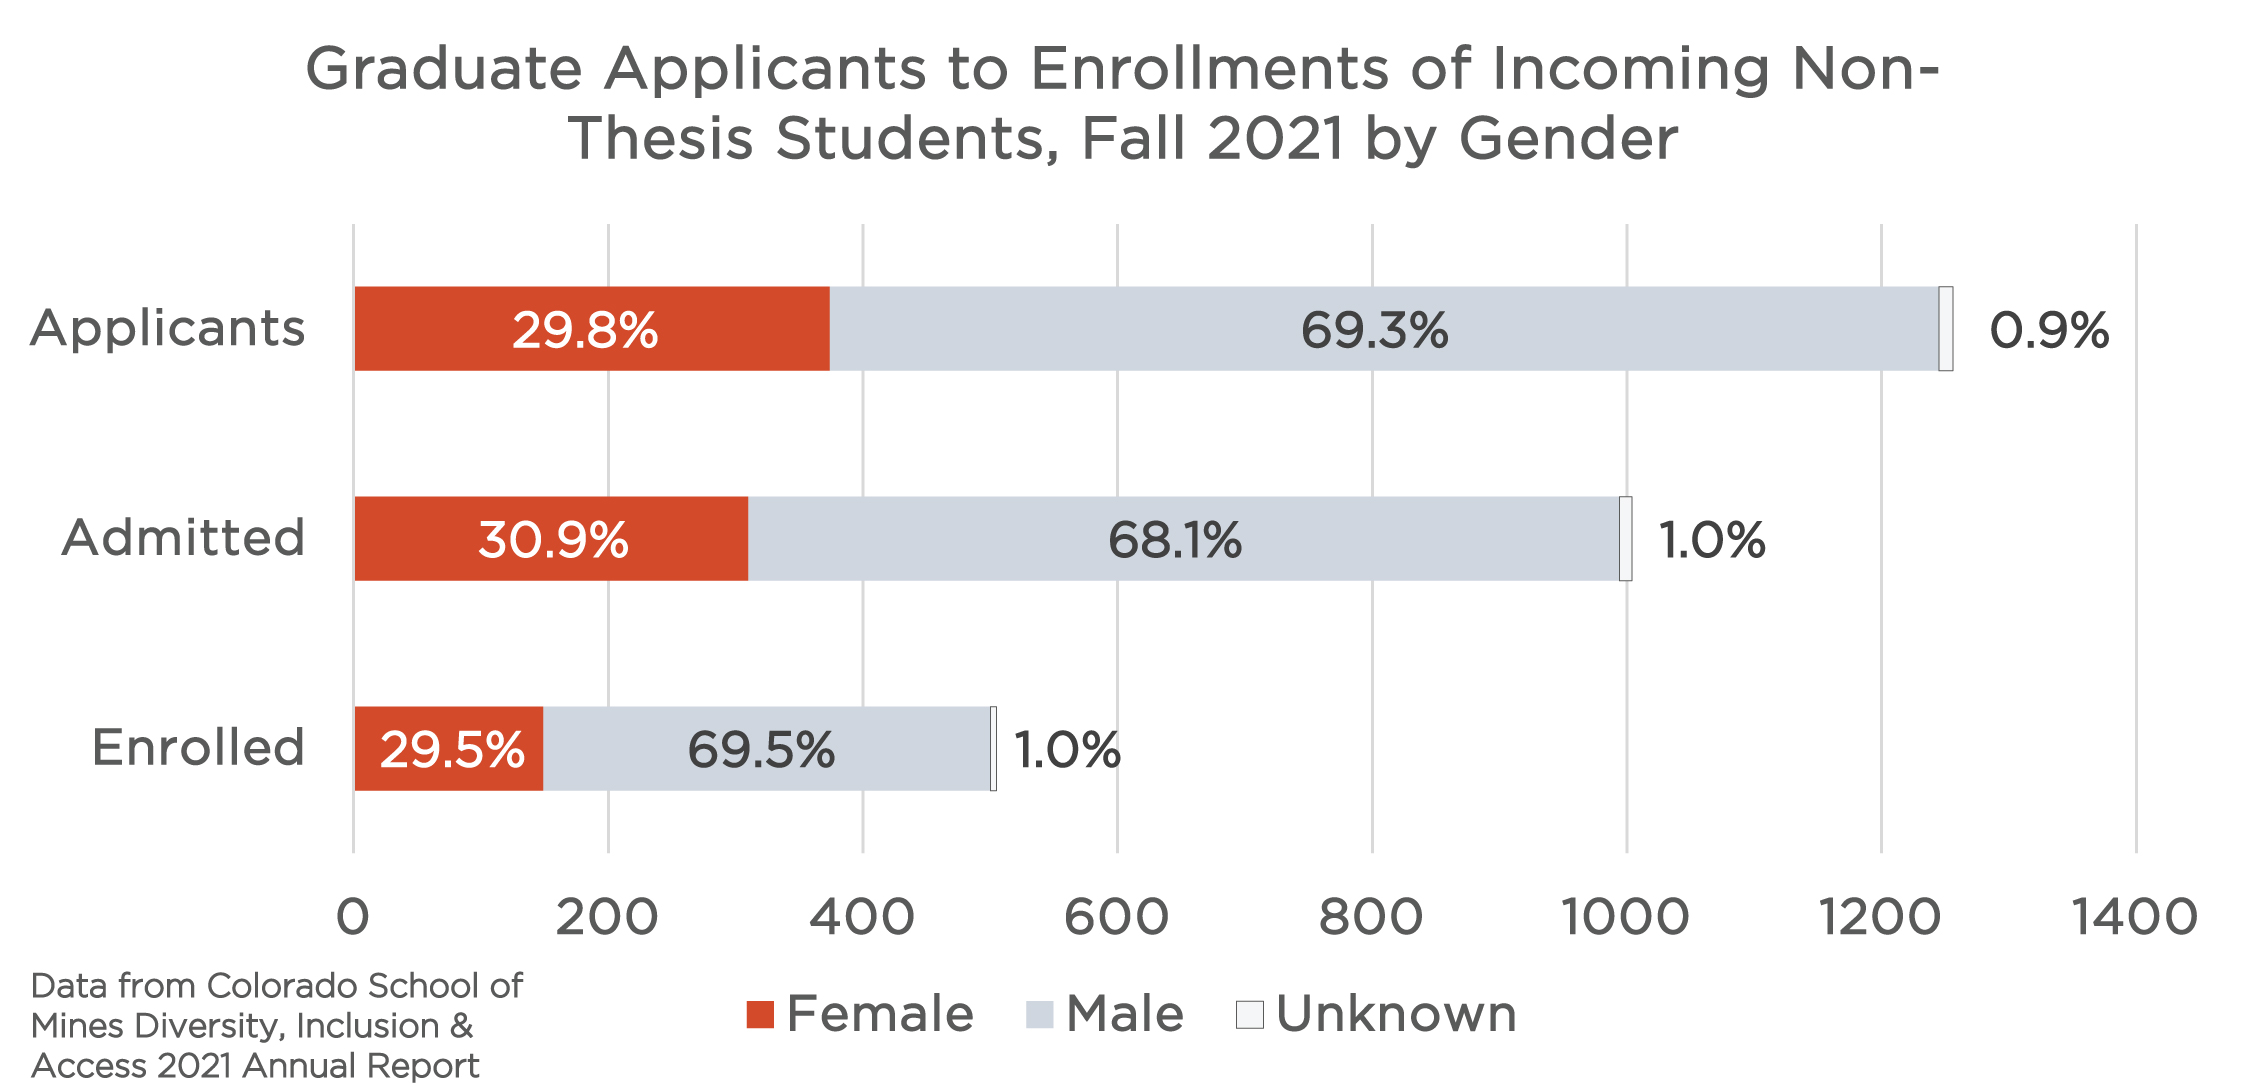 Click on graph image to view larger size Click on graph image to view larger size |
| This graph shows the number of applicants, students admitted and students enrolled at Mines for non-thesis graduate programs in fall 2021, broken down by race/ethnicity. There are some differences observed between the proportion of racial/ethnic marginalized identifying students who applied, were admitted and who enrolled. There were less than 15% who applied, however, nearly 18% enrolled, which is a positive outcome. Overall, there are still more white identifying students compared to racial/ethnic marginalized identifying and international students, combined. These data only include new, incoming non-thesis graduate students, and includes both residential (in-person) and online programs. The data include all degrees, except “null.” Non-thesis programs include Master’s non-thesis, graduate certificates and post-baccalaureate certificates. We define URG as those who identify as American Indian/Alaskan Native, African American/Black, Asian, Hispanic/Latinx, multiple races and Native Hawaiian/Pacific Islander. |  Click on graph image to view larger size Click on graph image to view larger size |
| This graph shows only the domestic students grouped by race and ethnicity. The United States has specific definitions and goals for diversity efforts, which typically include our marginalized populations of color excluding international populations here on a visa. Therefore, when we consider our MINES@150 goals for representation, we want to ensure that our US students are proportionally represented in our degree programs. Notice now the representation of our racial/ethnic marginalized populations proportionally increased substantially, as compared to when we included our international student population. Furthermore, these students maintain consistent proportions throughout the pipeline, meaning they are enrolling at similar rates as they are applying to Mines. These data only include new, incoming non-thesis graduate students, and includes both residential (in-person) and online programs. The data include all degrees, except “null.” Non-thesis programs include Master’s non-thesis, graduate certificates, and post-baccalaureate certificates. We define URG as those who identify as American Indian/Alaskan Native, African American/Black, Asian, Hispanic/Latinx, multiple races and Native Hawaiian/Pacific Islander. | 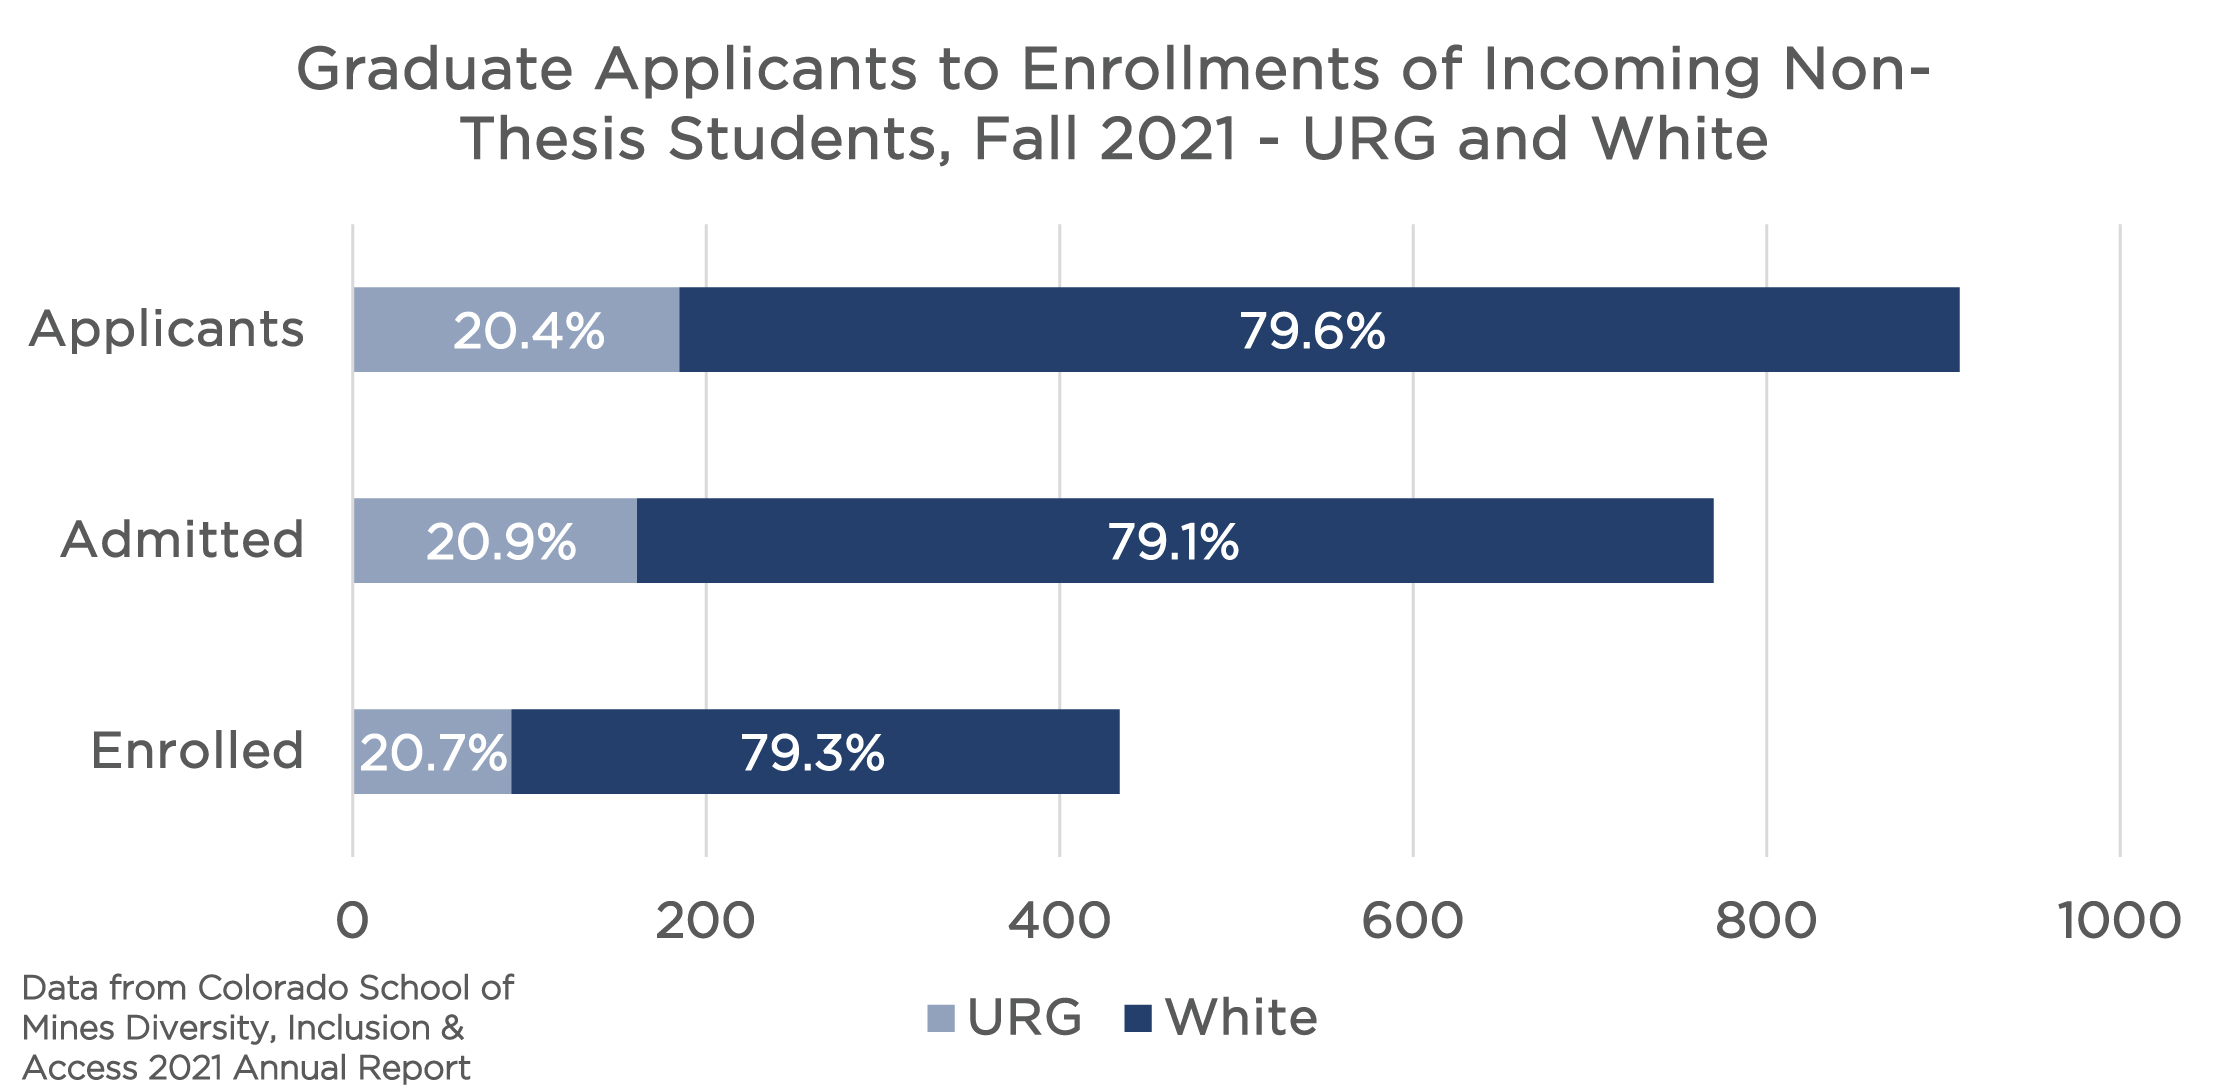 Click on graph image to view larger size Click on graph image to view larger size |
| This graph shows the number of applicants, students admitted and students enrolled at Mines for thesis graduate programs, in fall 2021, broken down by gender. There are some notable differences between the proportion of female identifying students who applied, were admitted and who enrolled; we observe that proportionally more students were admitted and enrolled than the proportion who applied. This shows that we’re admitting and enrolling more female identifying graduate students in our thesis programs than the proportion who apply. Overall, there are still more male identifying students compared to female identifying students. These data include new, incoming thesis graduate students and includes both residential (in-person) and online programs. The data include all degrees, except “null.” Thesis programs include Master’s and Doctoral degrees. Gender is defined here as only either male or female due to limitations in data collection and reporting. | 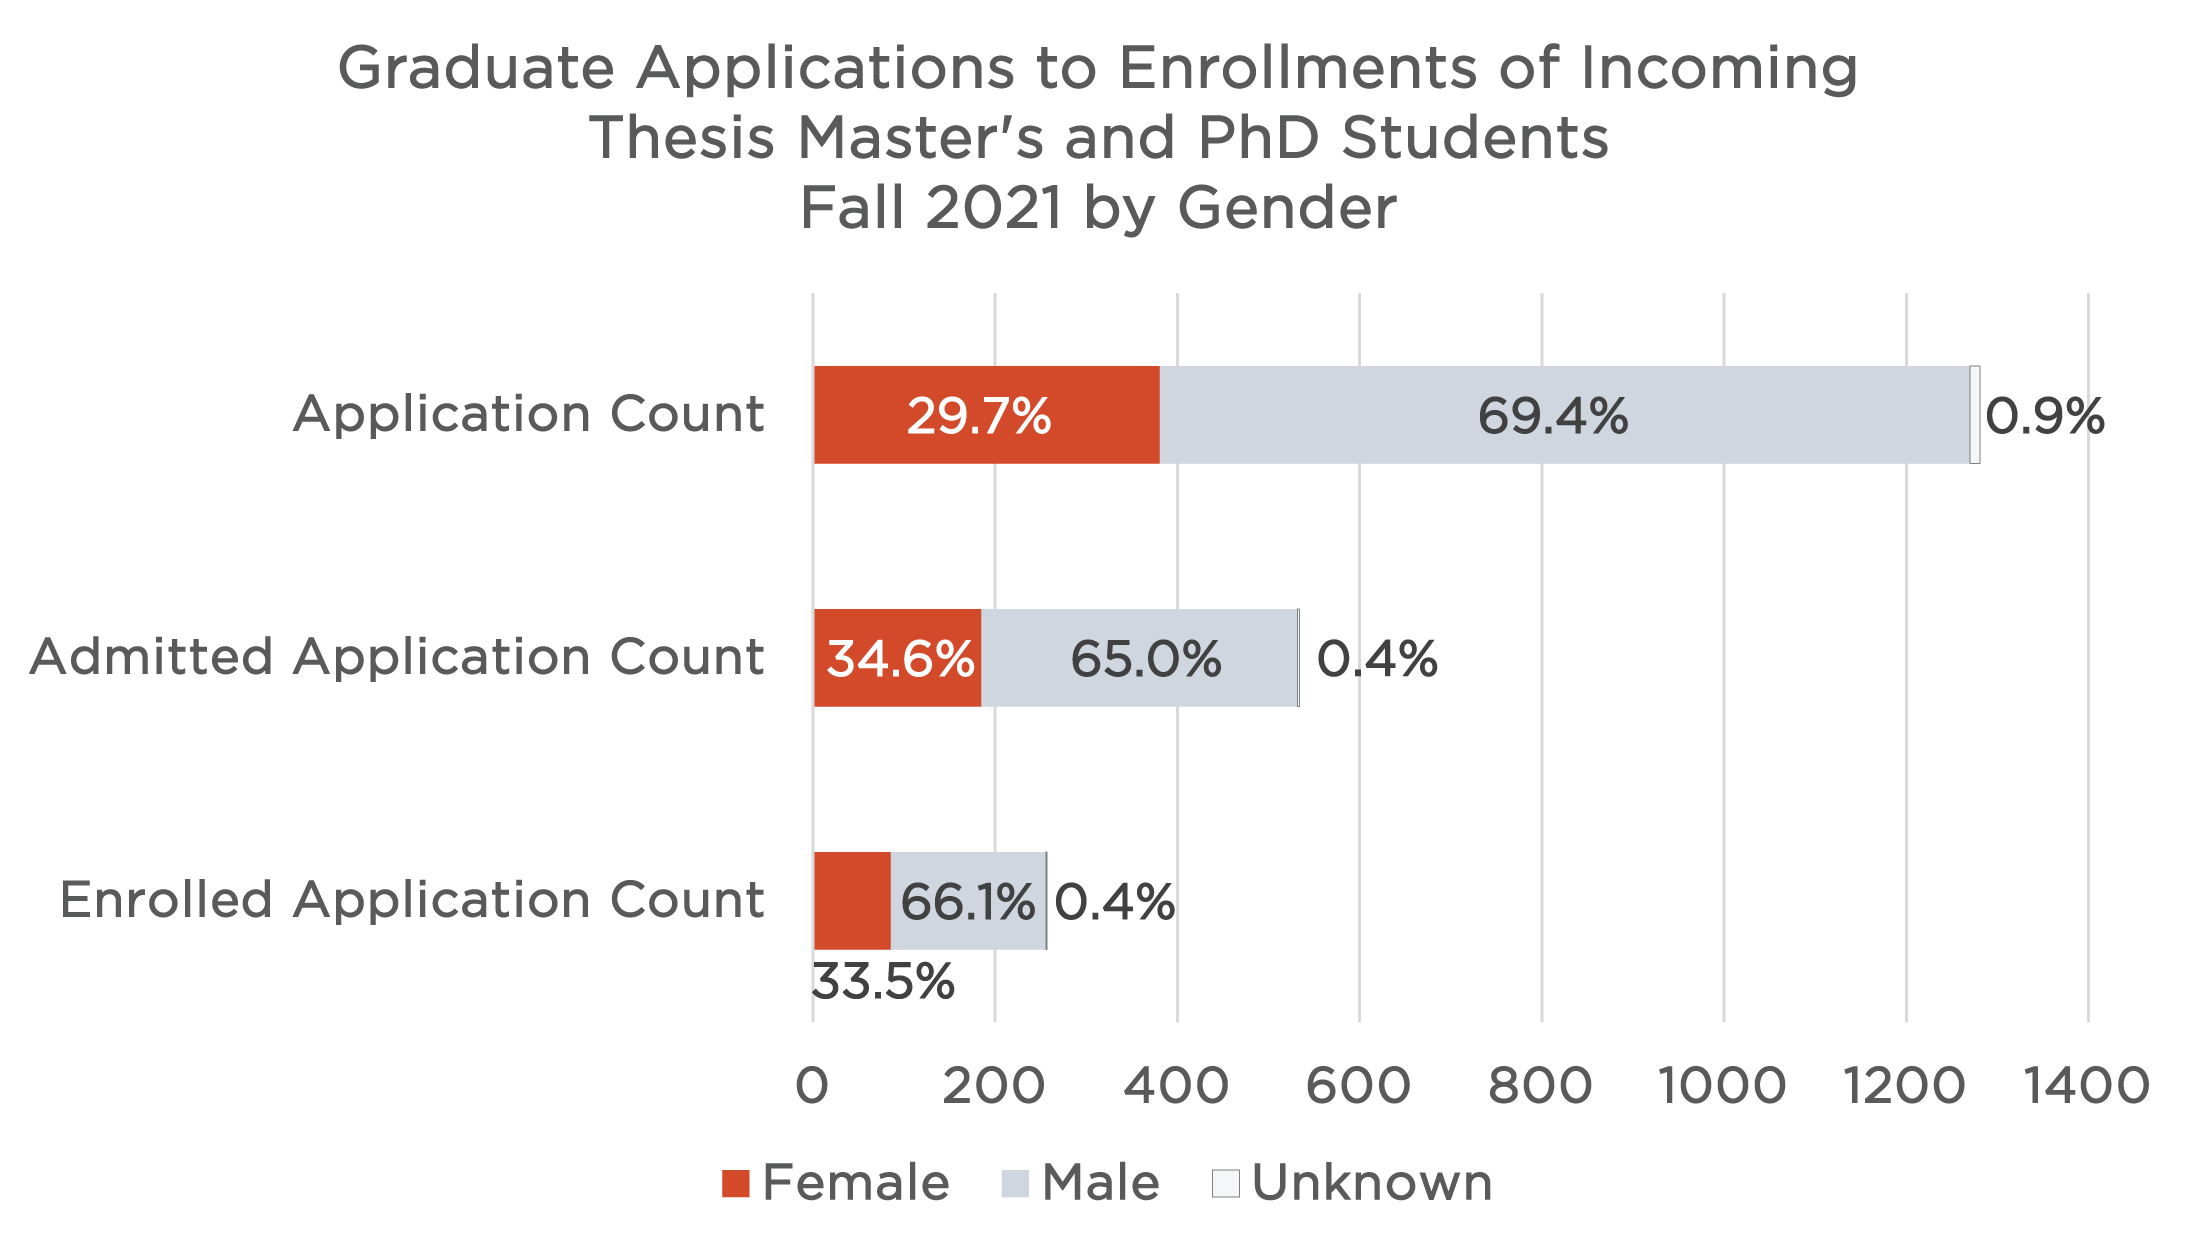 Click on graph image to view larger size Click on graph image to view larger size |
| This graph shows the number of applicants, students admitted and students enrolled at Mines for thesis graduate programs in fall 2021, broken down by race/ethnicity. There are some small differences observed between the proportion of racial/ethnic marginalized identifying students who applied, were admitted and who enrolled. Overall, there are still more white identifying students compared to racial/ethnic marginalized identifying and international students, especially in the admitted and enrolled phases. These data only include new, incoming thesis graduate students, and includes both residential (in-person) and online programs. The data include all degrees, except “null.” Thesis programs include Master’s and Doctoral degrees. We define URG as those who identify as American Indian/Alaskan Native, African American/Black, Asian, Hispanic/Latinx, multiple races and Native Hawaiian/Pacific Islander. | 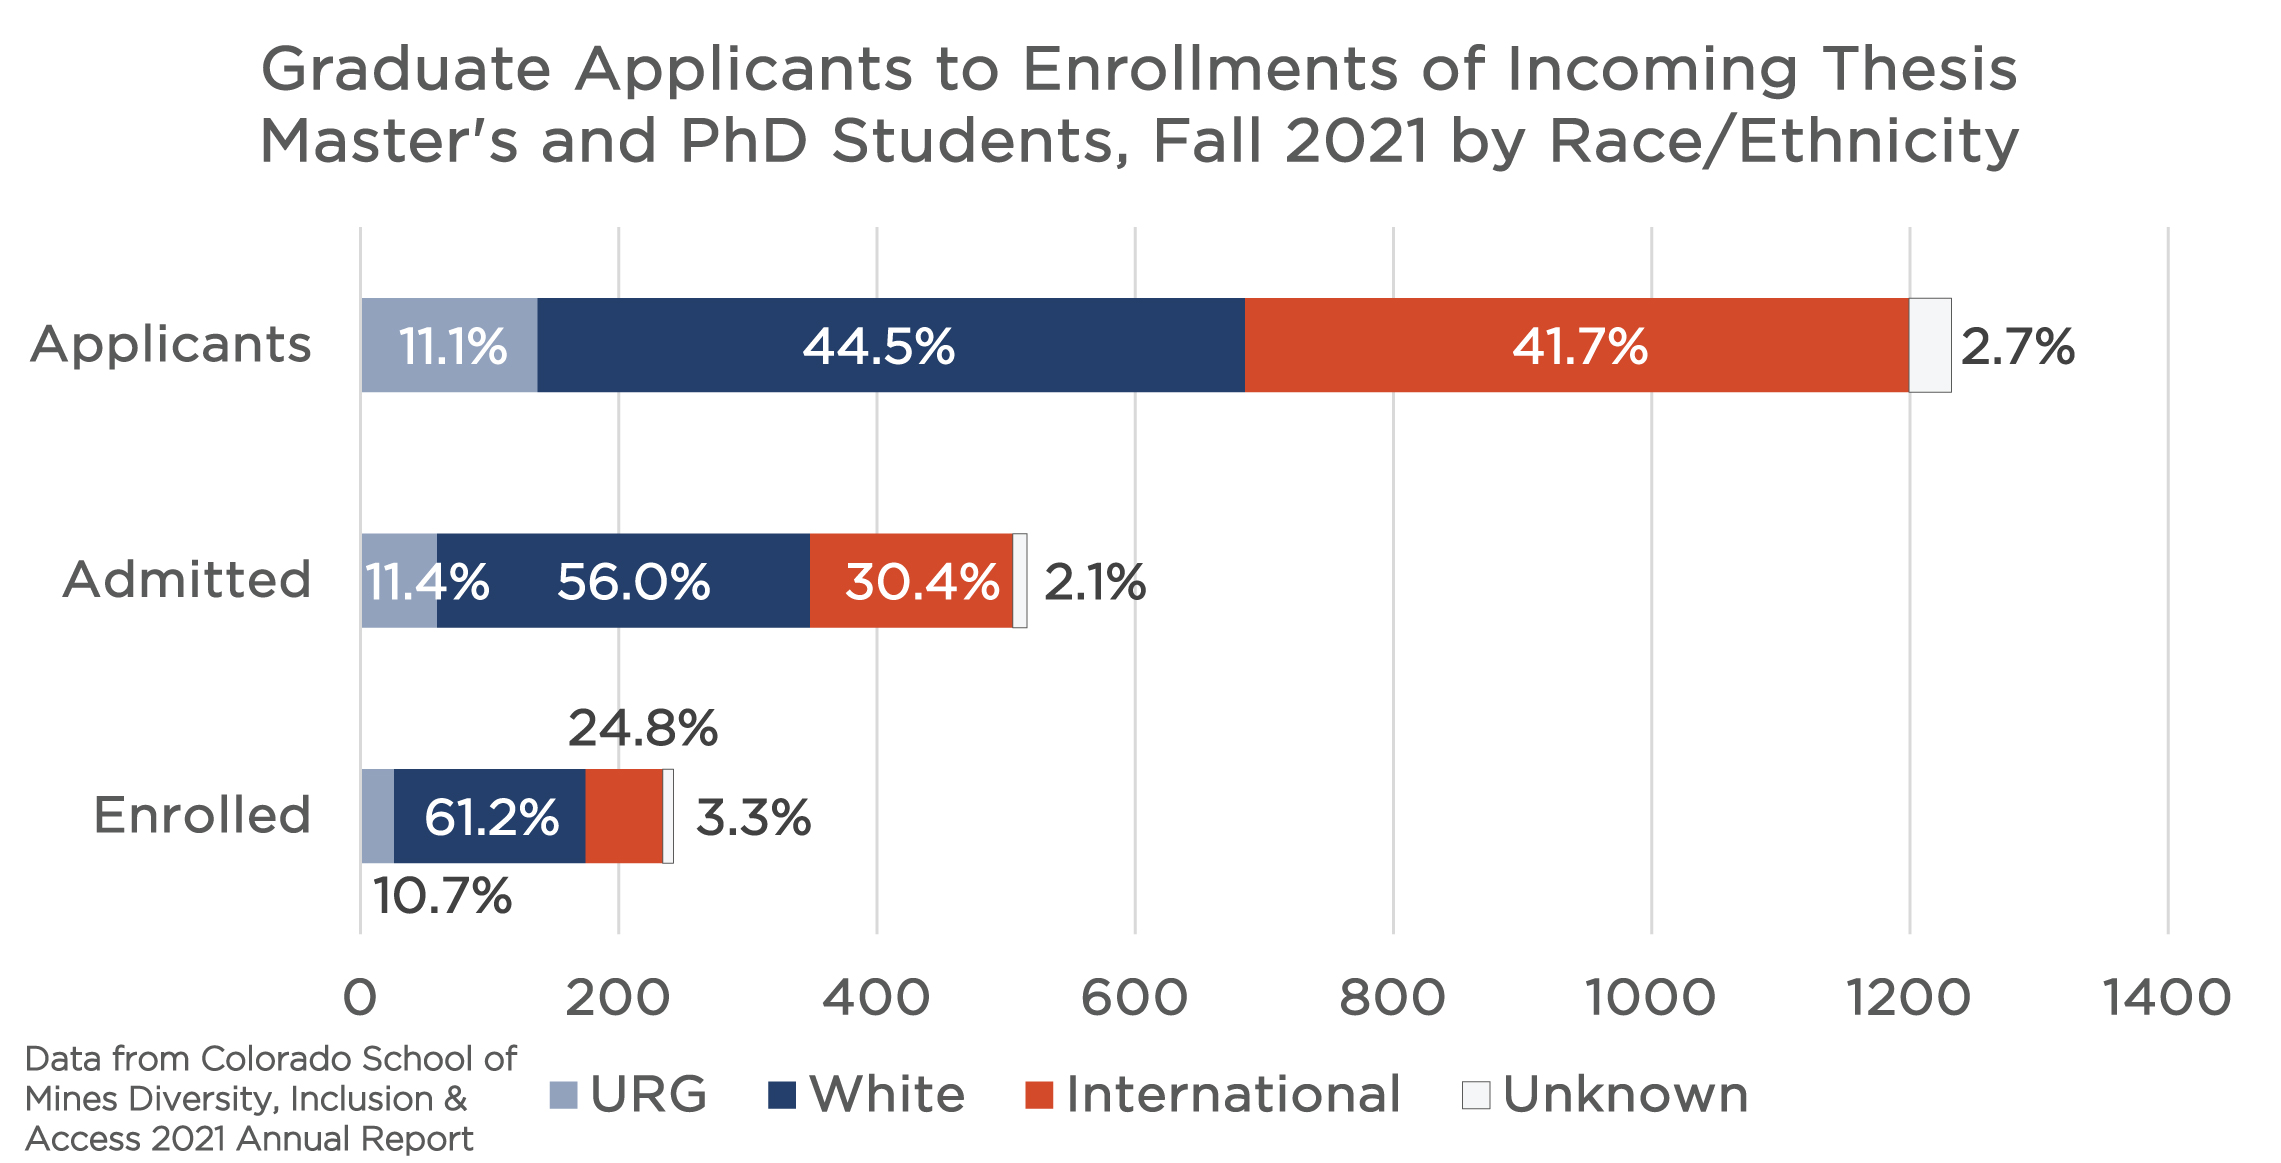 Click on graph image to view larger size Click on graph image to view larger size |
| This graph shows only the domestic students grouped by race and ethnicity. The United States has specific definitions and goals for diversity efforts, which typically include our marginalized populations of color excluding international populations here on a visa. Therefore, when we consider our MINES@150 goals for representation, we want to ensure that our US students are proportionally represented in our degree programs. Notice now the representation of our racial/ethnic marginalized populations proportionally increased substantially, as compared to when we included our international student population. However, these students apply at a considerably higher rate than they enroll at Mines, which is something to investigate further. One explanation could be higher financial aid awards from competing institutions. These data only include new, incoming thesis graduate students, and includes both residential (in-person) and online programs. The data include all degrees, except “null.” Thesis programs include Master’s and Doctoral degrees. We define URG as those who identify as American Indian/Alaskan Native, African American/Black, Asian, Hispanic/Latinx, multiple races, and Native Hawaiian/Pacific Islander. | 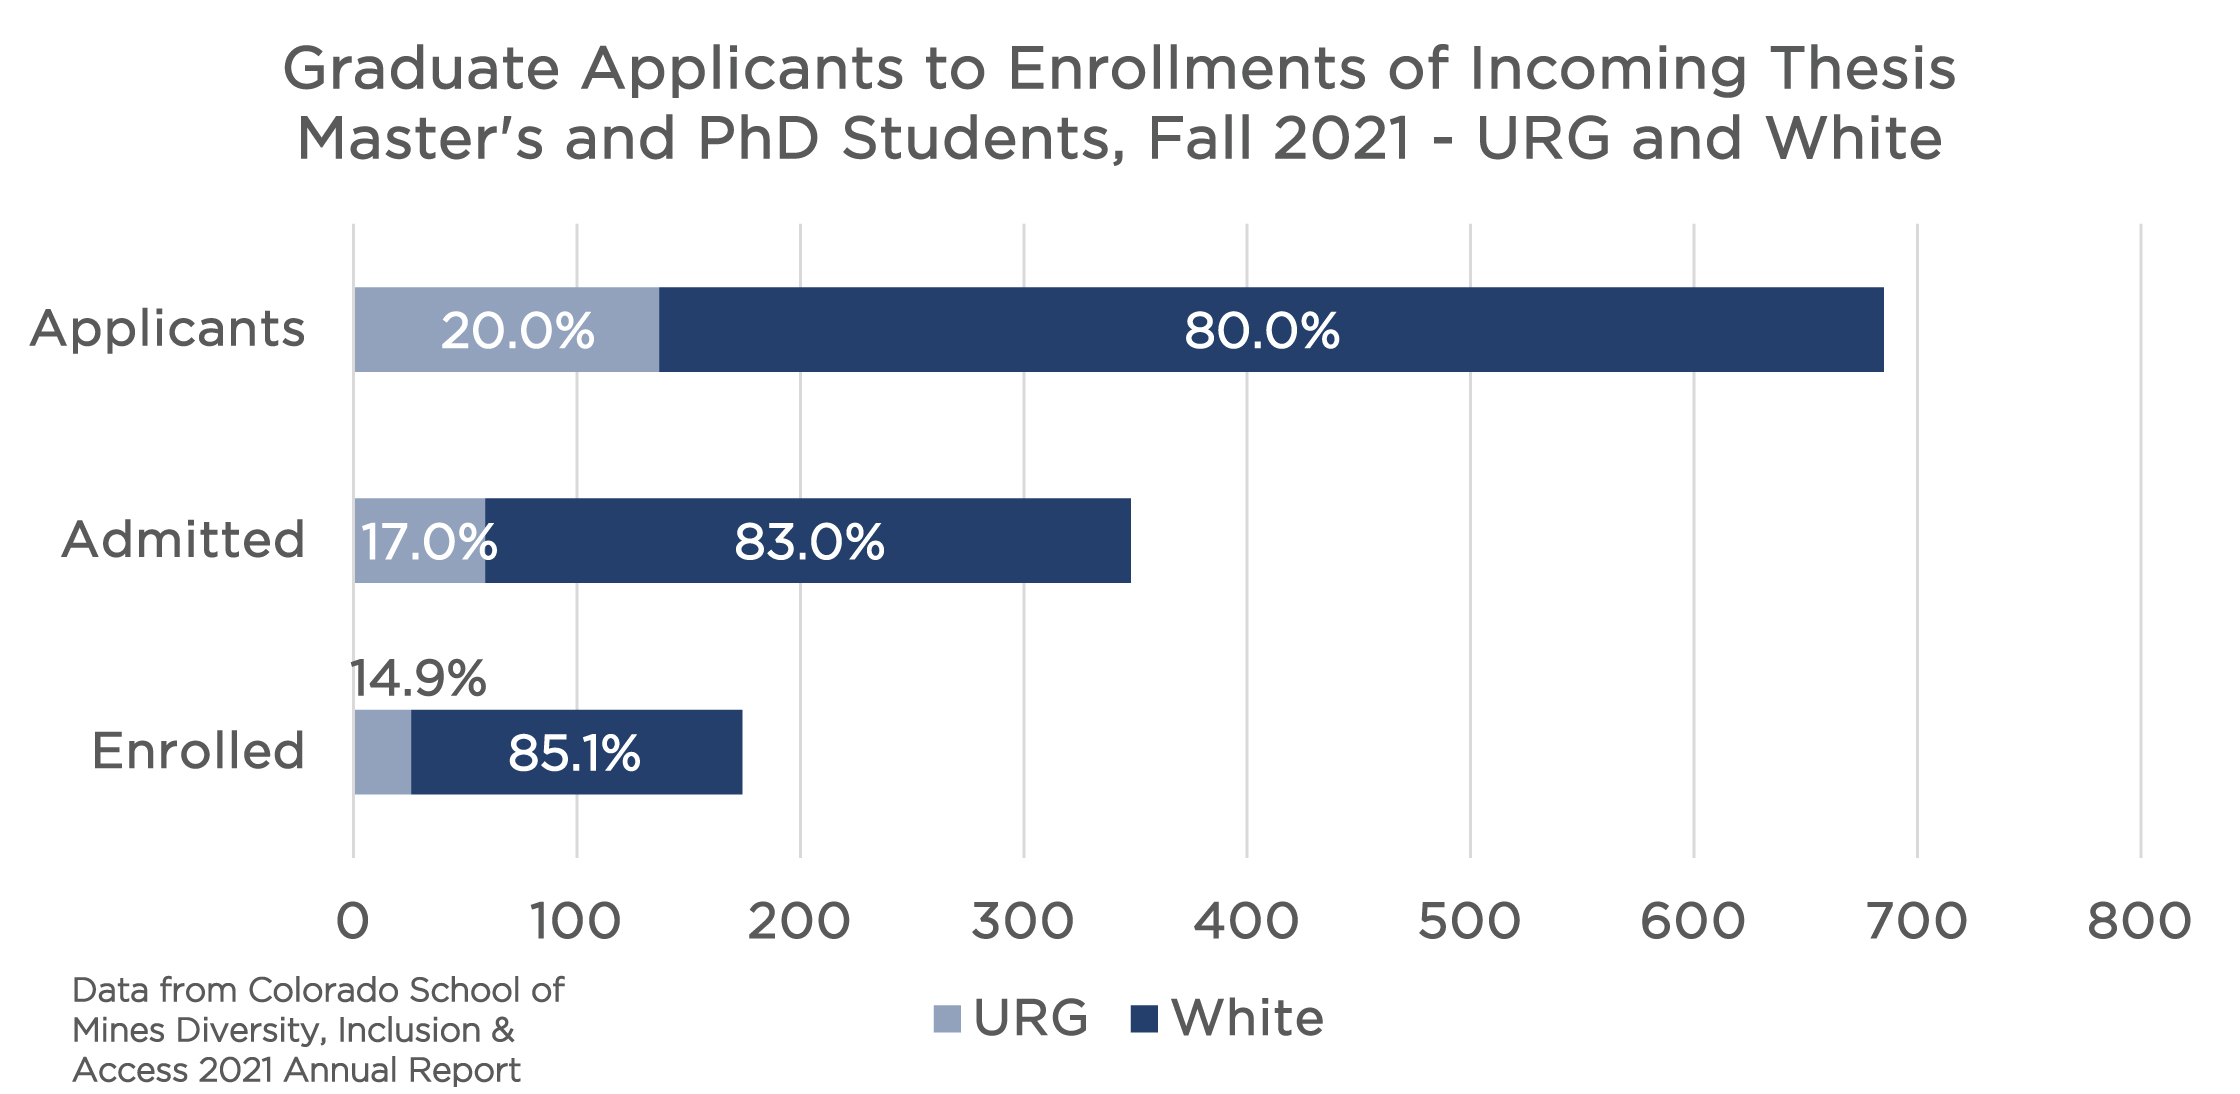 Click on graph image to view larger size Click on graph image to view larger size |
Other Enrollment Trends of Graduate Students
Similar to undergraduate admissions, the pandemic has shaped and influenced the graduate admissions landscape. For example, submitting GRE standardized test scores specifically for non-thesis Master’s applicants were waived starting in fall 2020 for all 38 non-thesis programs and 37 certificate programs. Of the 29 Master’s thesis programs, only one required the GRE for Mines alumni for the 2021 graduate admissions cycle and five required it for those coming into Mines for graduate school. Of the 28 PhD programs, again only one requires GRE scores to be submitted for Mines alumni and ten programs require the scores be submitted for students coming into Mines. We analyzed data between the non-thesis versus thesis programs to learn if waiving the GRE made significant differences in who enrolled, by gender and race/ethnicity demographics and few differences were observed. This is most likely due to the fact that only a small portion of our graduate thesis programs still required the GRE compared to those who continued to waive it, as denoted above. The next step would be to investigate the differences between the actual degree programs who waived the GRE compared to those who require it. If the GRE remains in question for upcoming admissions cycles, this will be considered.
| There is little difference between new student enrollments of non-thesis Master’s candidates who submitted their GRE scores in fall 2018 and 2019 compared to those who had the GRE waived in fall 2020 and 2021. These data are broken down by gender to show the enrollment proportions of new male and female identifying students and to observe any changes in demographic breakdowns between requiring and waiving the GRE. These data only include new, incoming non-thesis graduate students and includes both residential (in-person) and online programs. Non-thesis programs include Master’s non-thesis, graduate certificates and post-baccalaureate certificates. Gender is defined here as only either male or female due to limitations in data collection and reporting. | 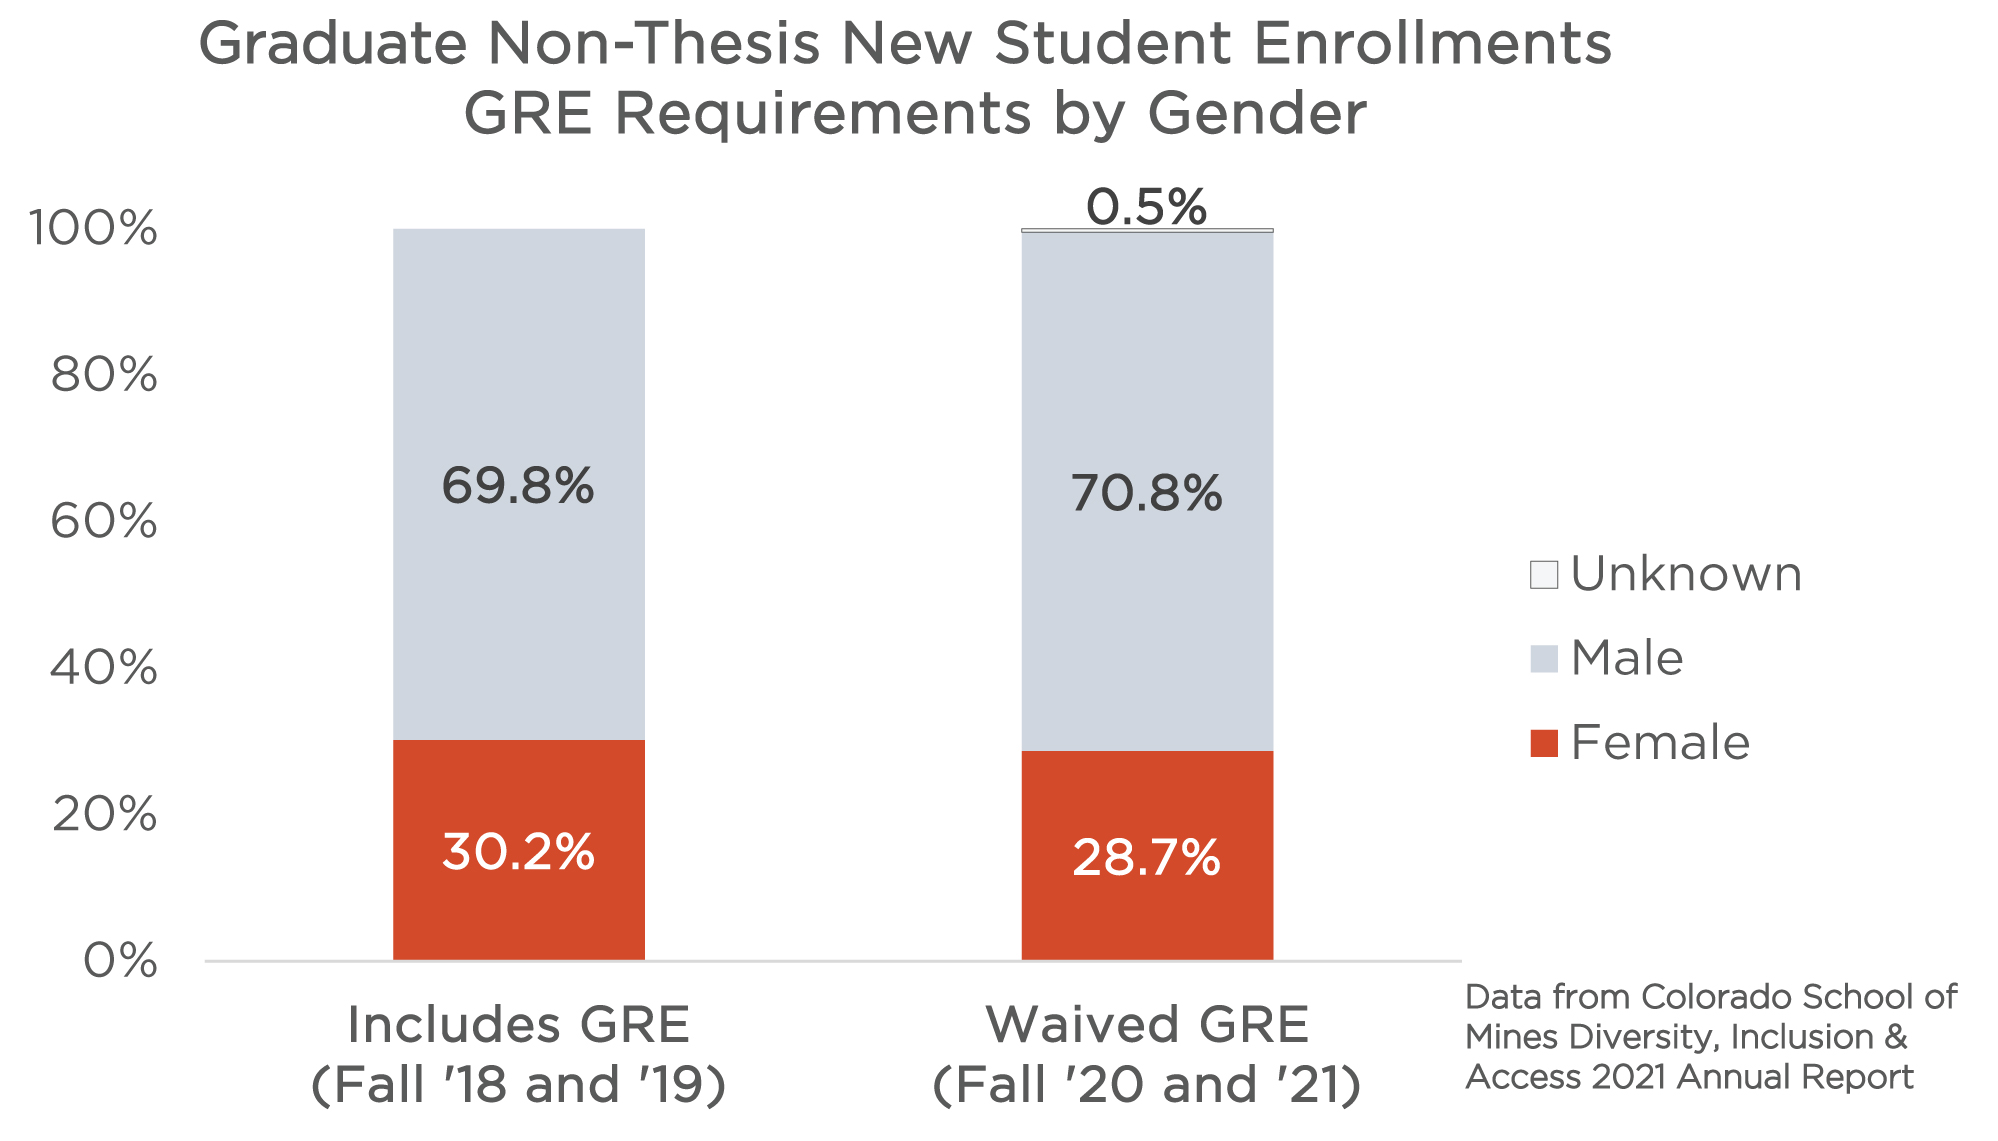 Click on graph image to view larger size Click on graph image to view larger size |
| There is some difference between new student enrollments of non-thesis Master’s candidates who submitted their GRE scores in fall 2018 and 2019 compared to those who had the GRE waived in fall 2020 and 2021 by race and ethnicity. These data are broken down by race and ethnicity to show the enrollment proportions of new students and to observe any changes in demographic breakdowns between requiring and waiving the GRE. Interestingly, there are proportionally fewer marginalized and international students who enrolled while the GRE was waived, compared to a higher proportion of white students. Reasons for this small change require further investigation but could be due to other external stressors related to the pandemic. These data only include new, incoming non-thesis graduate students, and includes both residential (in-person) and online programs. Non-thesis programs include Master’s non-thesis, graduate certificates, and post-baccalaureate certificates. We define URG as those who identify as American Indian/Alaskan Native, African American/Black, Asian, Hispanic/Latinx, multiple races and Native Hawaiian/Pacific Islander. | 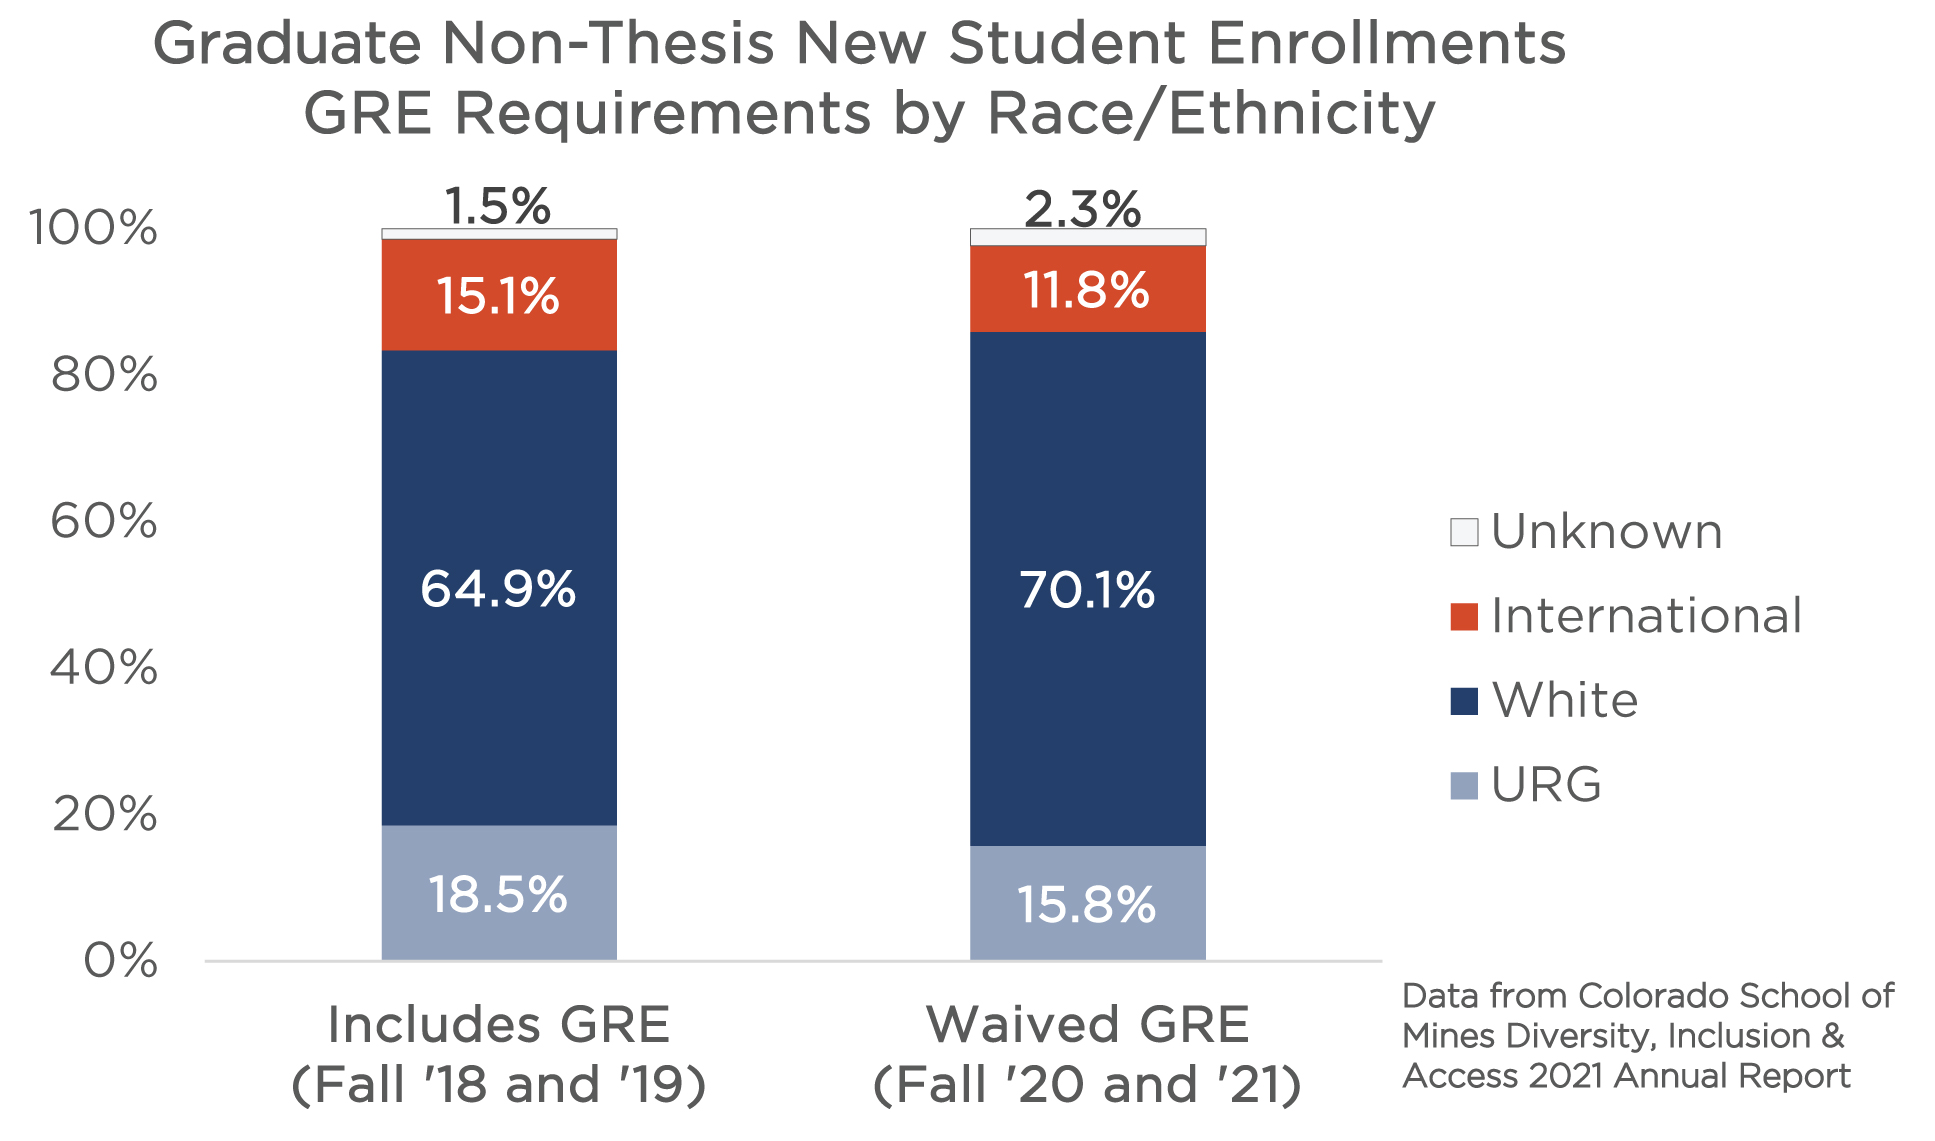 Click on graph image to view larger size Click on graph image to view larger size |
Mines’ Hiring Excellence (HEx) program was implemented in 2017 as a close collaboration between Mines DI&A and Human Resources. HEx applies the best practices found in the National Science Foundation’s ADVANCE program to broaden evidence-based strategies for promoting equity in higher education hiring. At Mines, we developed a workshop for hiring committees and teams to learn about and reduce the impacts of implicit bias to foster a more diverse, equitable and representative Mines workforce. This work directly ties into the MINES@150 goals. Since 2018, the HEx workshops have been implemented for all Academic Faculty searches and all Administrative Faculty searches since 2019. Momentum has picked up in 2021 with more requests for Hiring Excellence workshops than before; this education continues to be viewed as valuable and has considerable impacts on recruitment.
The Hiring Excellence program has three main objectives:
-
- To build awareness of inclusive hiring practices
- To broaden Mines’ talent pool and attract qualified diverse talent
- Empower search committee members with clear roles and accountability
- To support teams in making the best hiring decisions
Hiring Excellence has made several strategic changes to Mines’ hiring processes. Mines has included human resources professionals trained in talent acquisition that are integral to every hiring committee or team. Mines now requires a statement about Diversity, Inclusion and Access from all academic and administrative director-level applicants. Reviewing these statements informs hiring committees to the values and priorities a new candidate would bring to Mines and how their perspectives align to Mines’ mission and MINES@150 goals. Hiring committees use rubrics to review application materials and interviews to reduce implicit biases in decision making. DI&A best practices are implemented in every step of the hiring process. For Academic Faculty positions, all final candidates recommended for hire must meet with the President and Provost before an offer is made. This ensures Mines leadership is engaged in hiring to align with our MINES@150 goals.
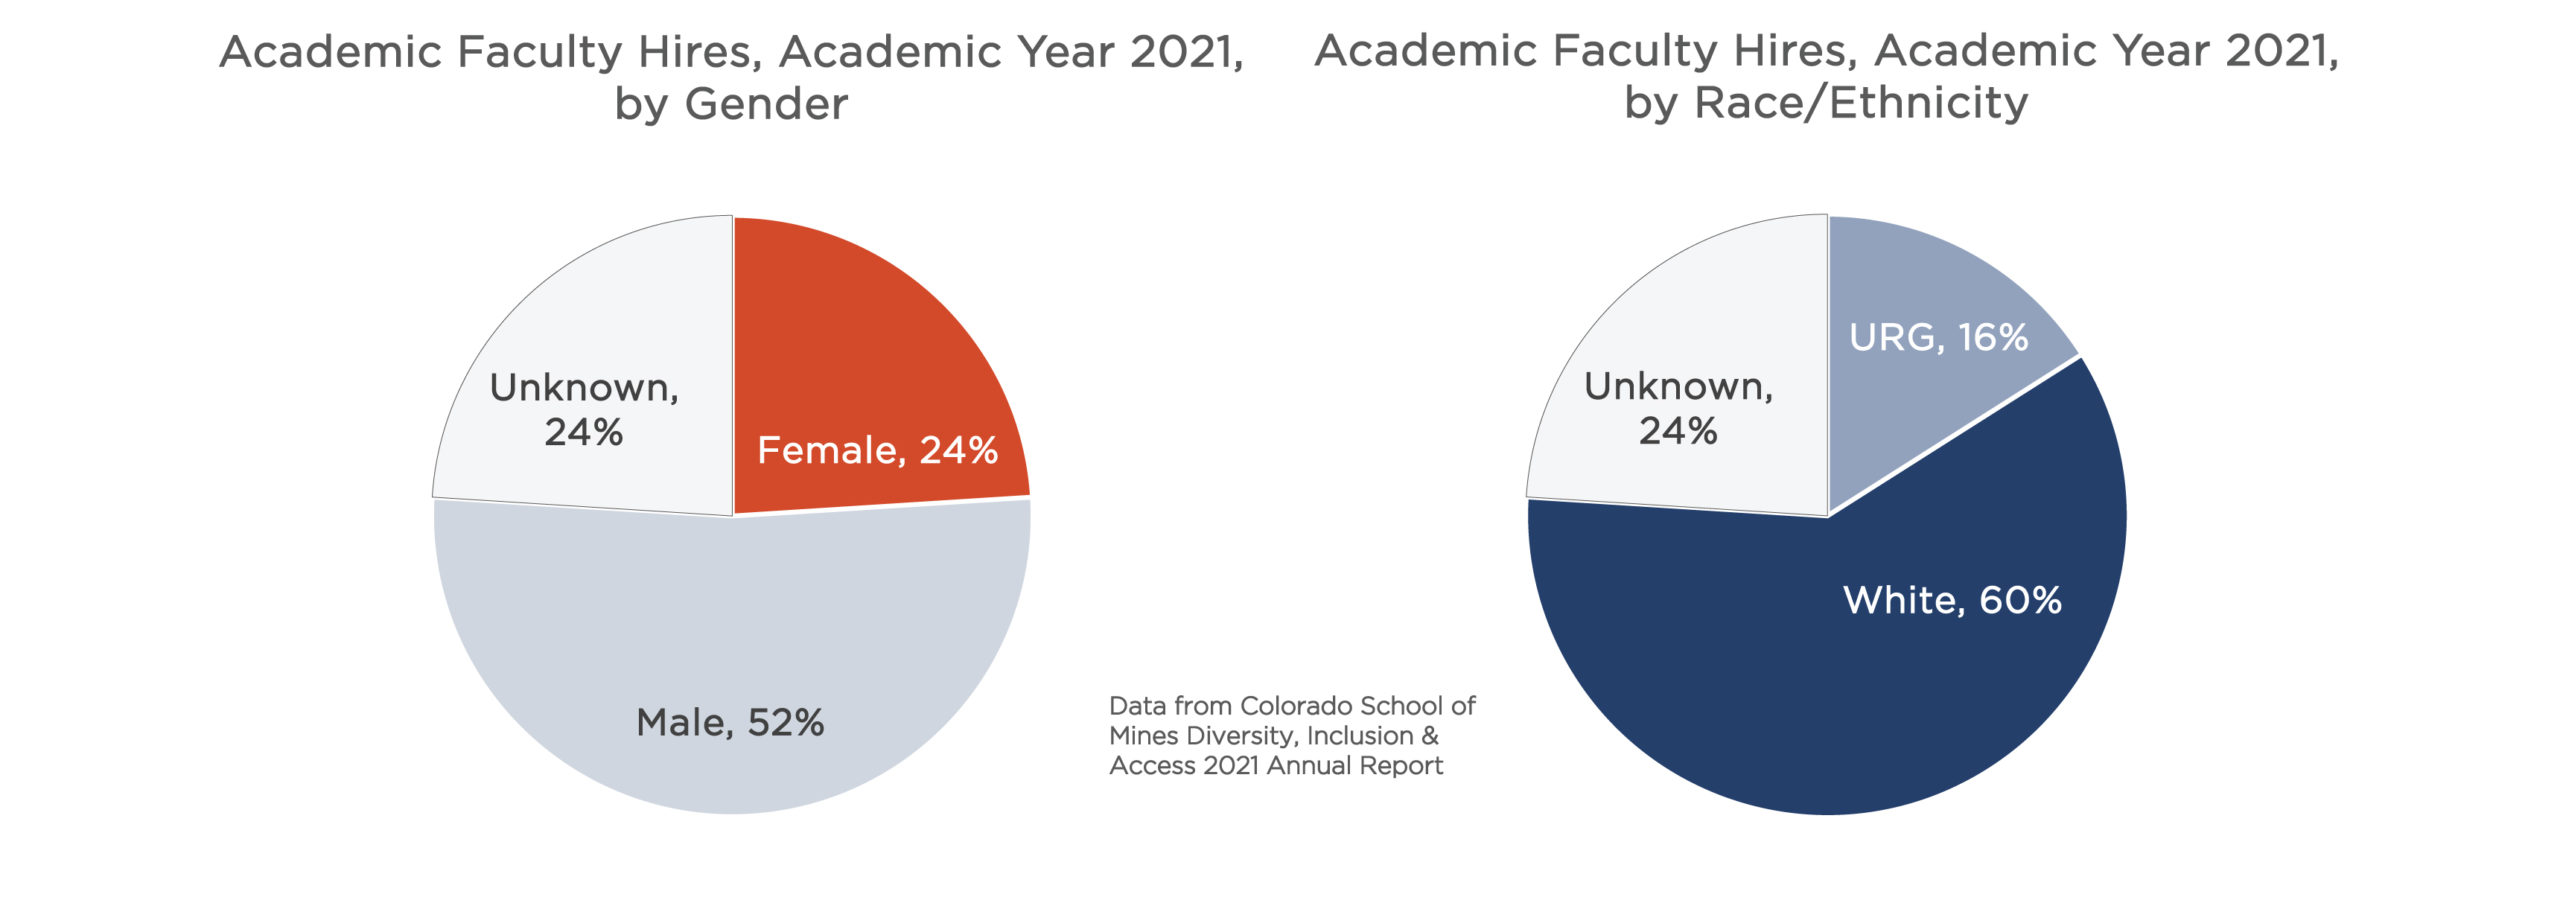
| Academic Faculty have specific hiring cycles and start each year in September. Because of this, the data presented include hires made for the 2021 Academic Year, which are hires made between August 2020 and July 2021 for a start date of August 2021. The recruitment cycle for the 2021 Academic Faculty hires was during the height of the pandemic in 2020. Thus, this had an impact on recruitment. For example, several faculty searches were cancelled during this time due to a campus hiring freeze in 2020. Notably, representation of racial/ethnic marginalized groups increased between 2020 and 2021. Both the Gender and Race/Ethnicity graphs contain “unknown” values as a result of candidates not disclosing demographic information. The term URG is “underrepresented groups” and includes those who identify as American Indian/Alaskan Native, African American/Black, Asian, Hispanic/Latinx, multiple races and Native Hawaiian/Pacific Islander. Gender is defined here as only either male or female due to limitations in data collection and reporting. |
Click on graph image to view larger size |
| Administrative Faculty are hired throughout the calendar year. These data include new positions created for the institution, backfills (when an employee leaves and a new person is hired in the same position), and promotions for the fiscal year 2021. Notably, representation of racial/ethnic marginalized groups increased between 2020 and 2021. Both the Gender and Race/Ethnicity graphs contain “unknown” values as a result of candidates not disclosing demographic information. The term URG is “underrepresented groups” and includes those who identify as American Indian/Alaskan Native, African American/Black, Asian, Hispanic/Latinx, multiple races and Native Hawaiian/Pacific Islander. Gender is defined here as only either male or female due to limitations in data collection and reporting. | 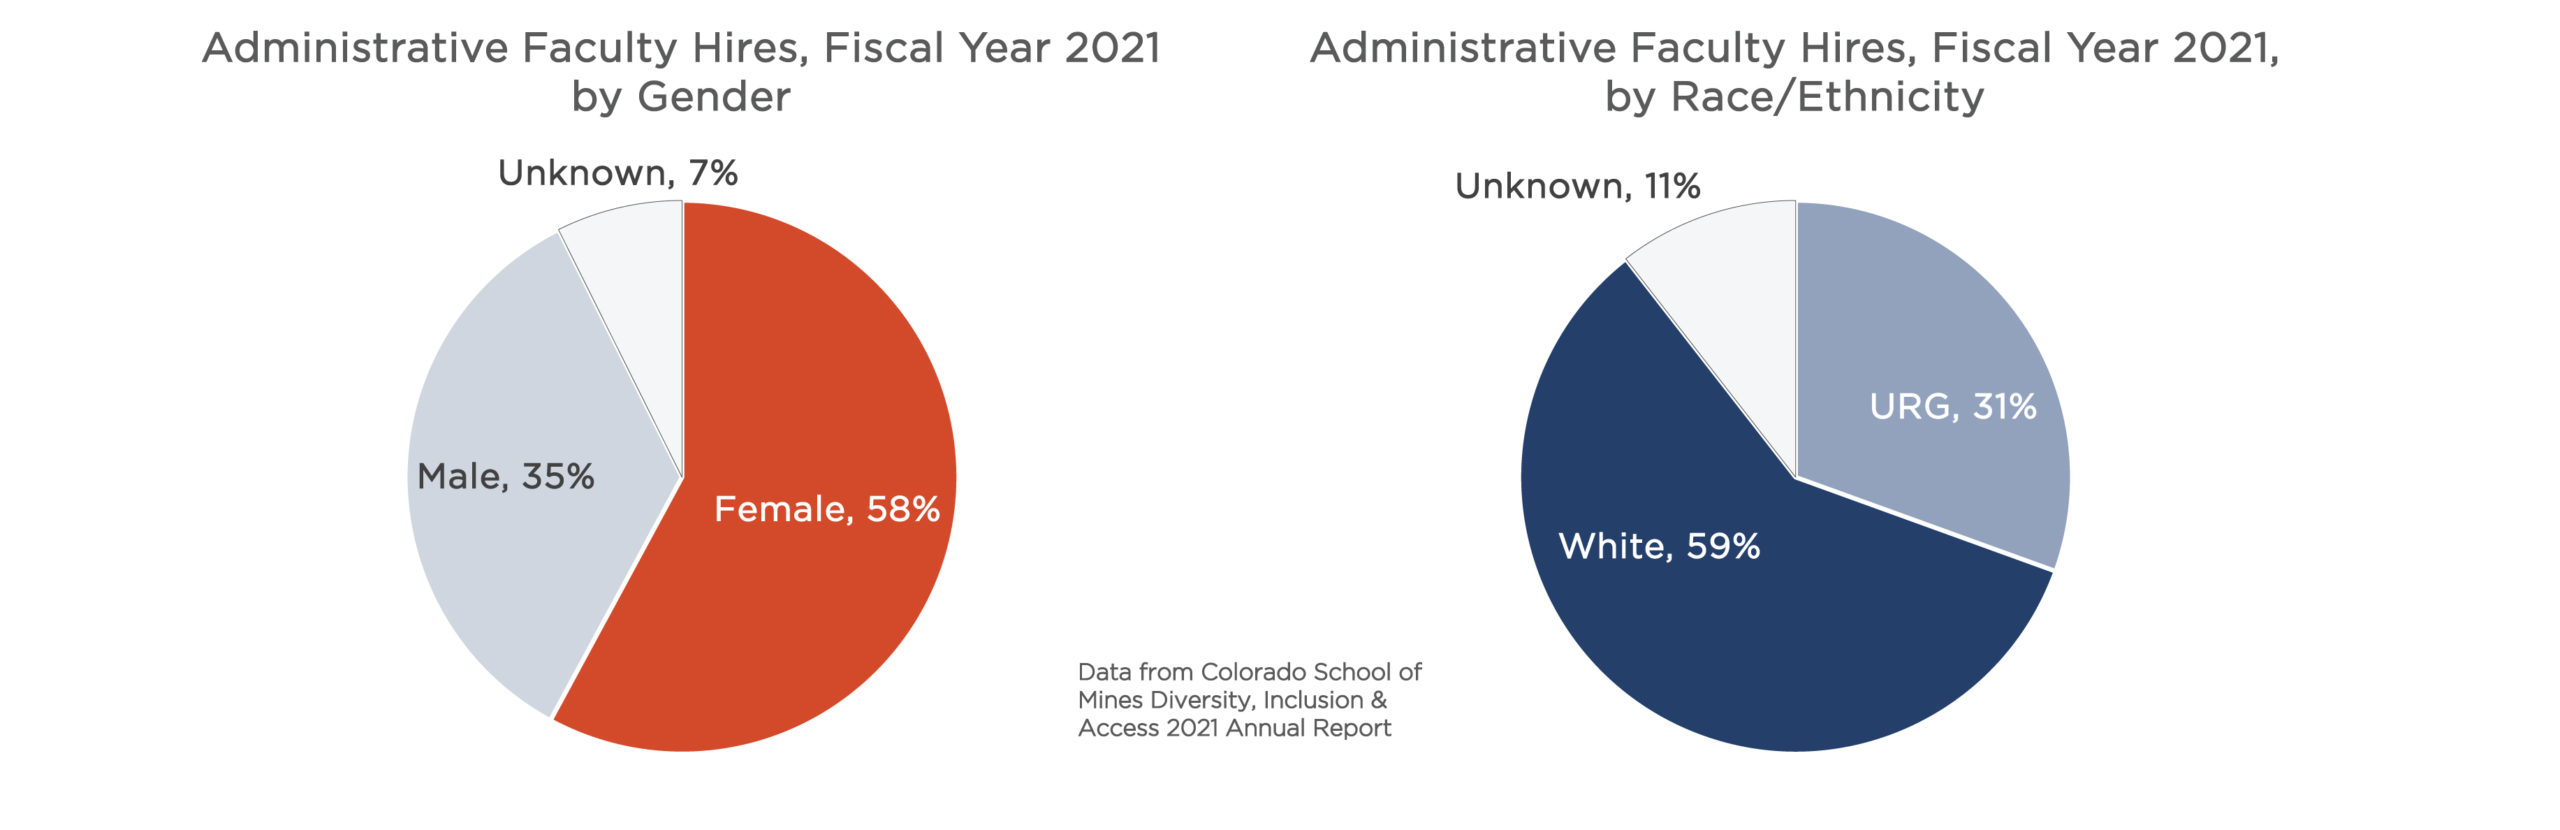 Click on graph image to view larger size Click on graph image to view larger size |
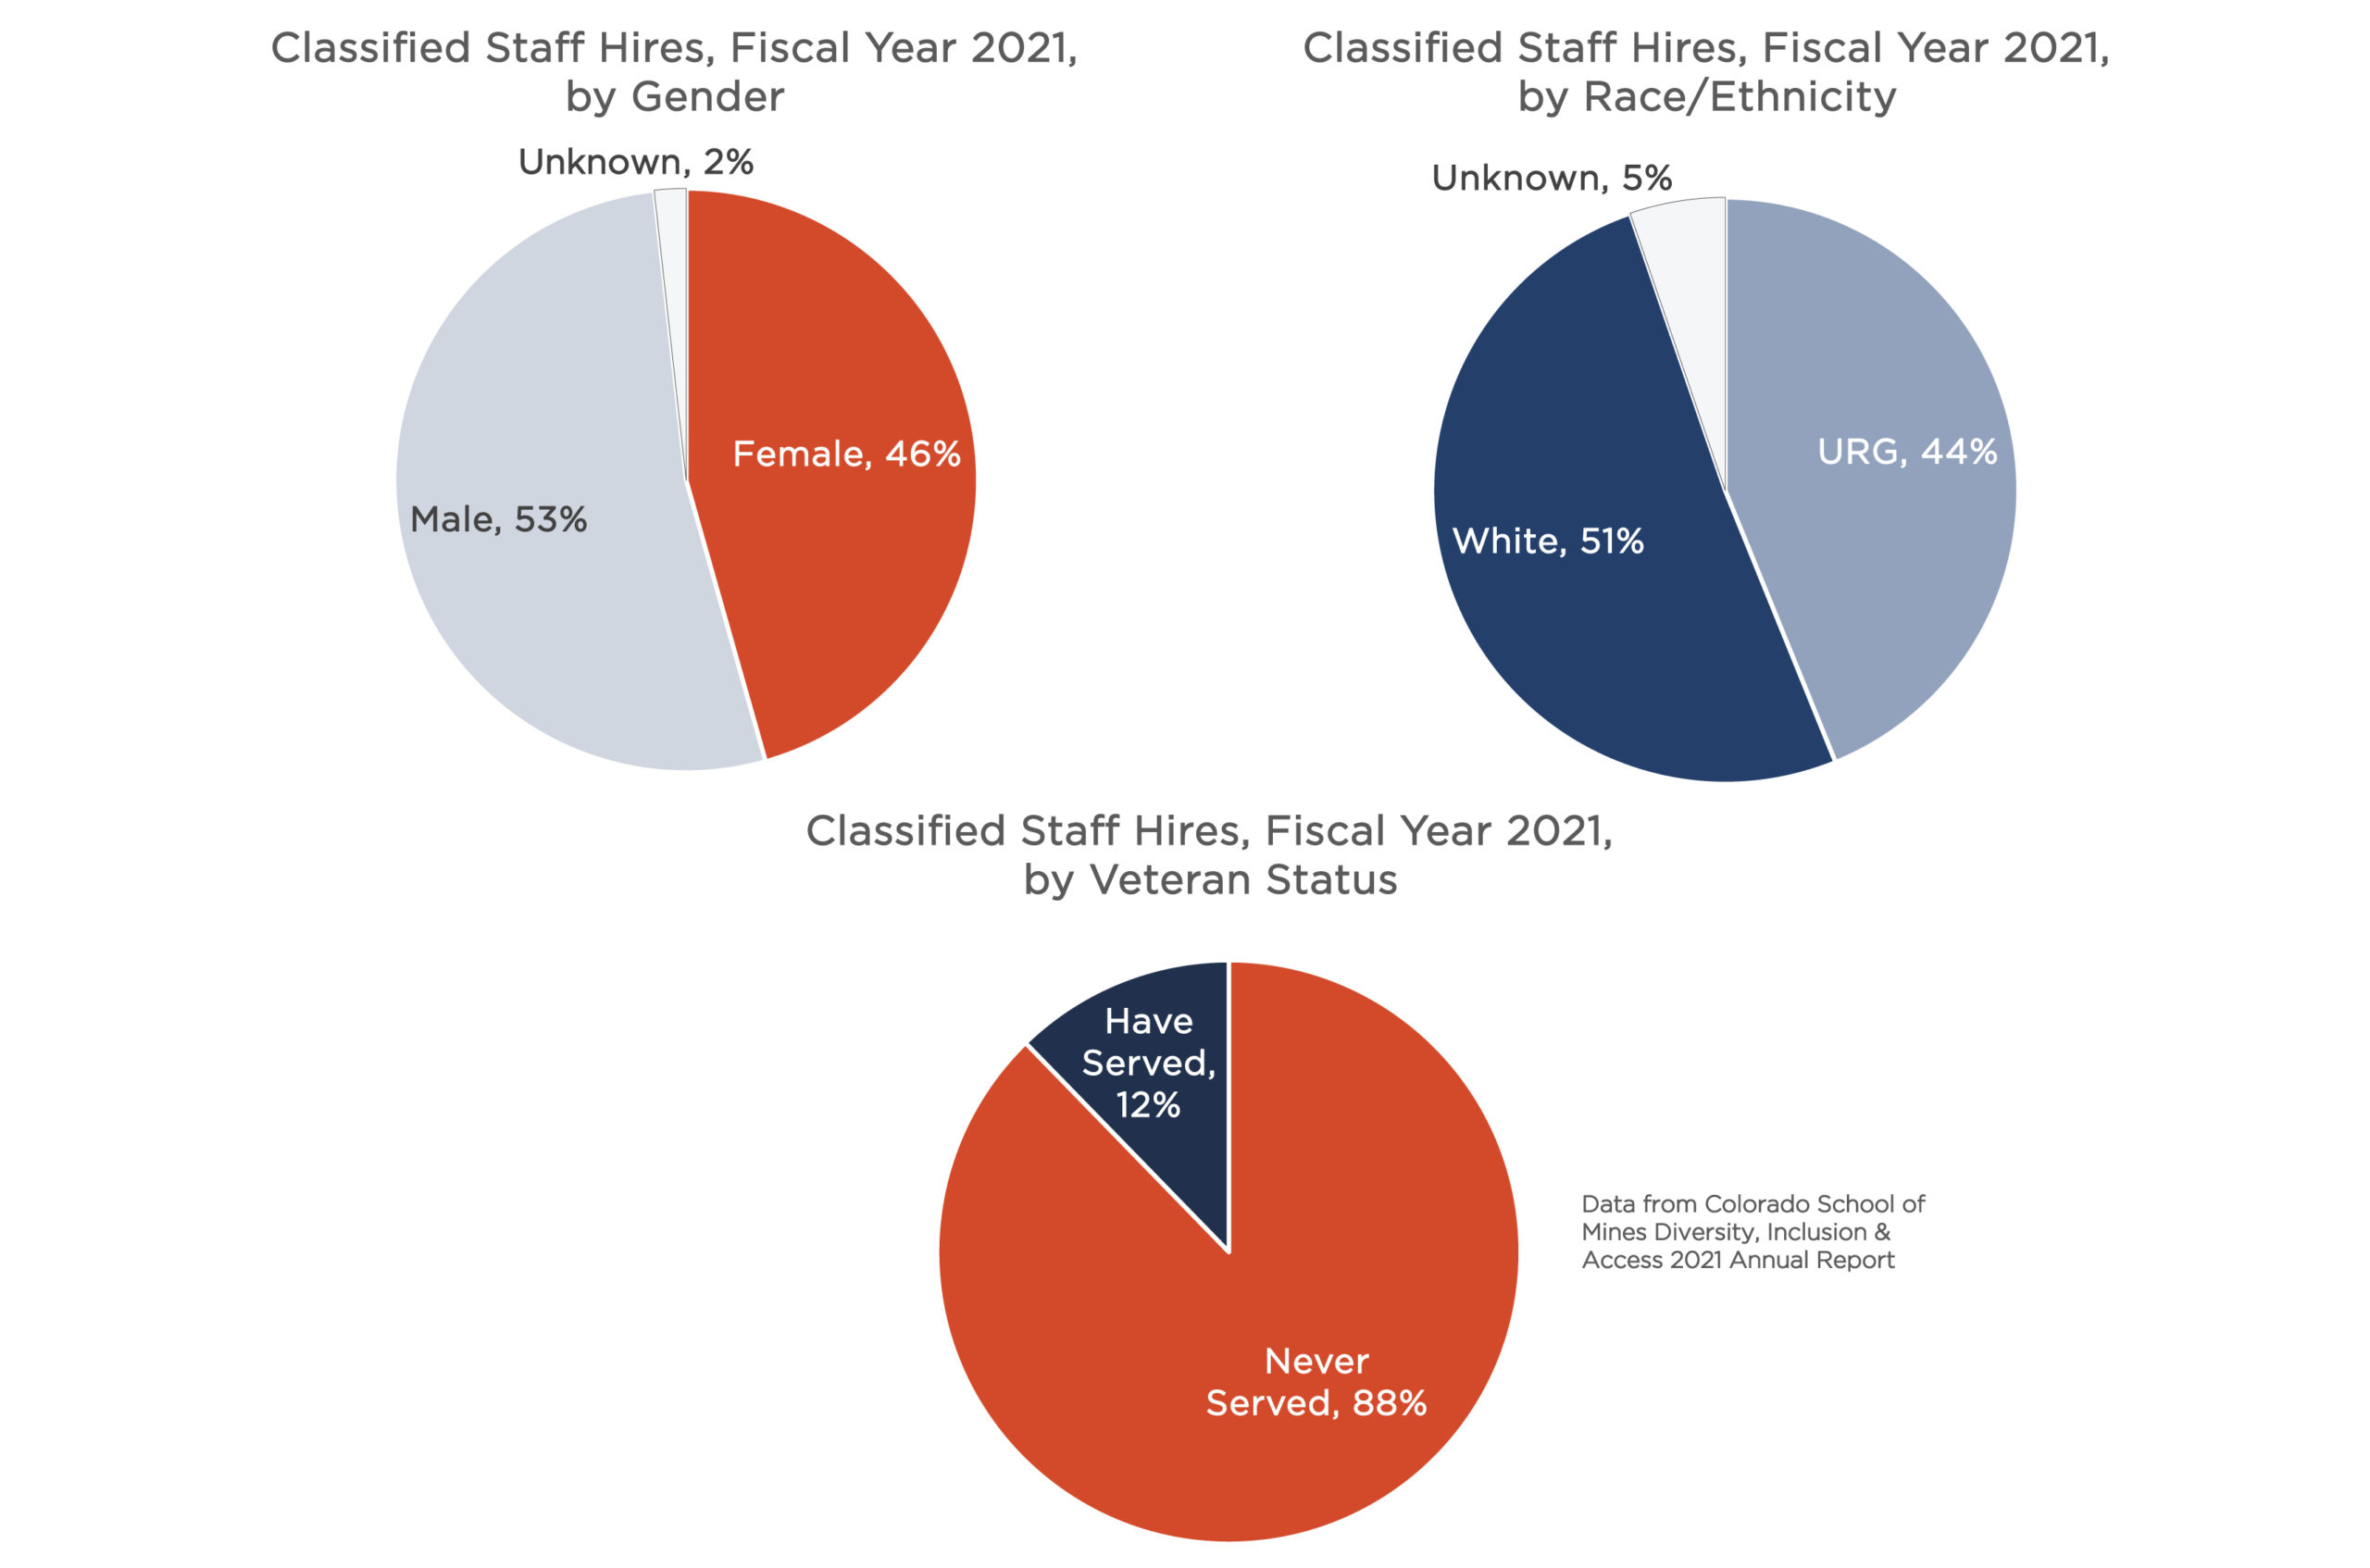
| Classified Staff are hired throughout the calendar year. These data are for the 2021 fiscal year and were pulled from the state government issued hiring platform where all classified positions are advertised. Due to a discrepancy between this platform and Mines’ hiring platform, some data are omitted from these analyses. Our data show three categories: gender, race/ethnicity and veteran status. “Unknown” values are a result of candidates not disclosing demographic information. The term URG is “underrepresented groups” and includes those who identify as American Indian/Alaskan Native, African American/Black, Asian, Hispanic/Latinx, multiple races and Native Hawaiian/Pacific Islander. Gender is defined here as only either male or female due to limitations in data collection and reporting. |
Click on graph image to view larger size |
It is critically important that Mines, as an institution, reflects the demographics from which we draw talent, as outlined in the Strategic Plan. Representation matters for underrepresented or marginalized groups because having role models, mentors, advocates and peers to go to is essential for one’s success and reduces attrition. The following data and efforts highlight some of the work Mines is doing to ensure we have representation throughout the institution.
- Fall 2020 to Fall 2021 Undergraduate Enrollments
- Providing Guidance on Social Identities Through Mentoring
- Mentor and Mentee Social Identity Representation 1
- Mentor and Mentee Social Identity Representation 2
|
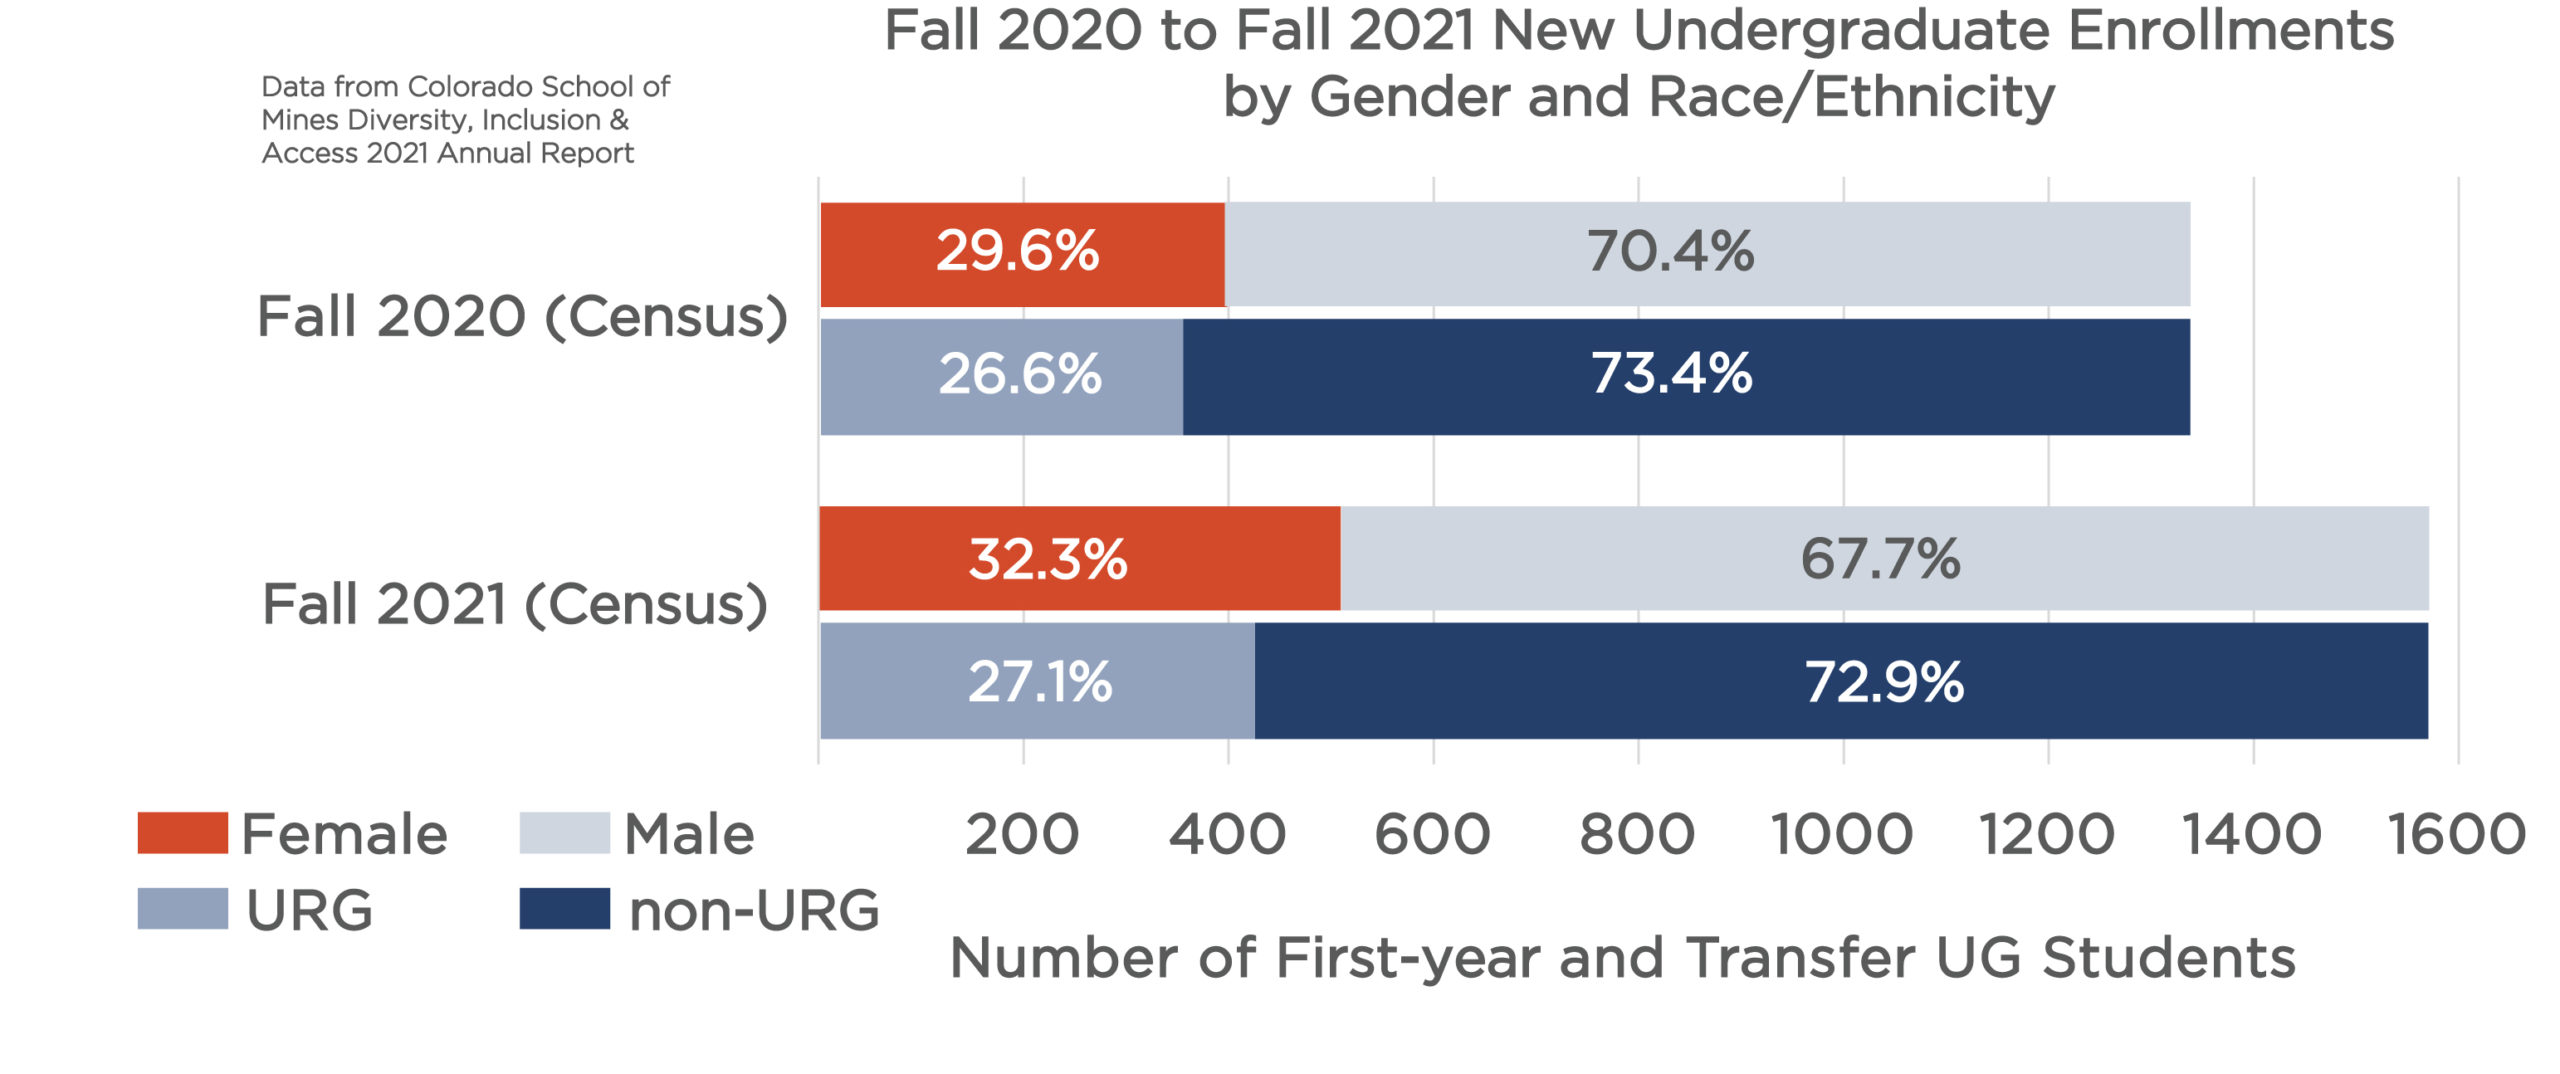
The data show a comparison of fall 2020 to fall 2021 enrollments of new incoming first-year and transfer undergraduate students. The top bars in red vs. gray show the gender distribution. The bottom bars in shades of blue show the race/ethnicity distribution, where URG = underrepresented groups and non-URG are white and international students and those who don’t report their data. We define URG as those who identify as American Indian/Alaskan Native, African American/Black, Asian, Hispanic/Latinx, multiple races and Native Hawaiian/Pacific Islander. Gender is defined here as only either male or female due to limitations in data collection and reporting. Comparing fall 2020 to fall 2021, the number of women increased by 28%, while students of color increased by 20%, making this incoming class the most diverse in Mines history. These increases in marginalized groups outpace the total increase of enrollments, which was 17% from fall 2020 to fall 2021. |
|
|
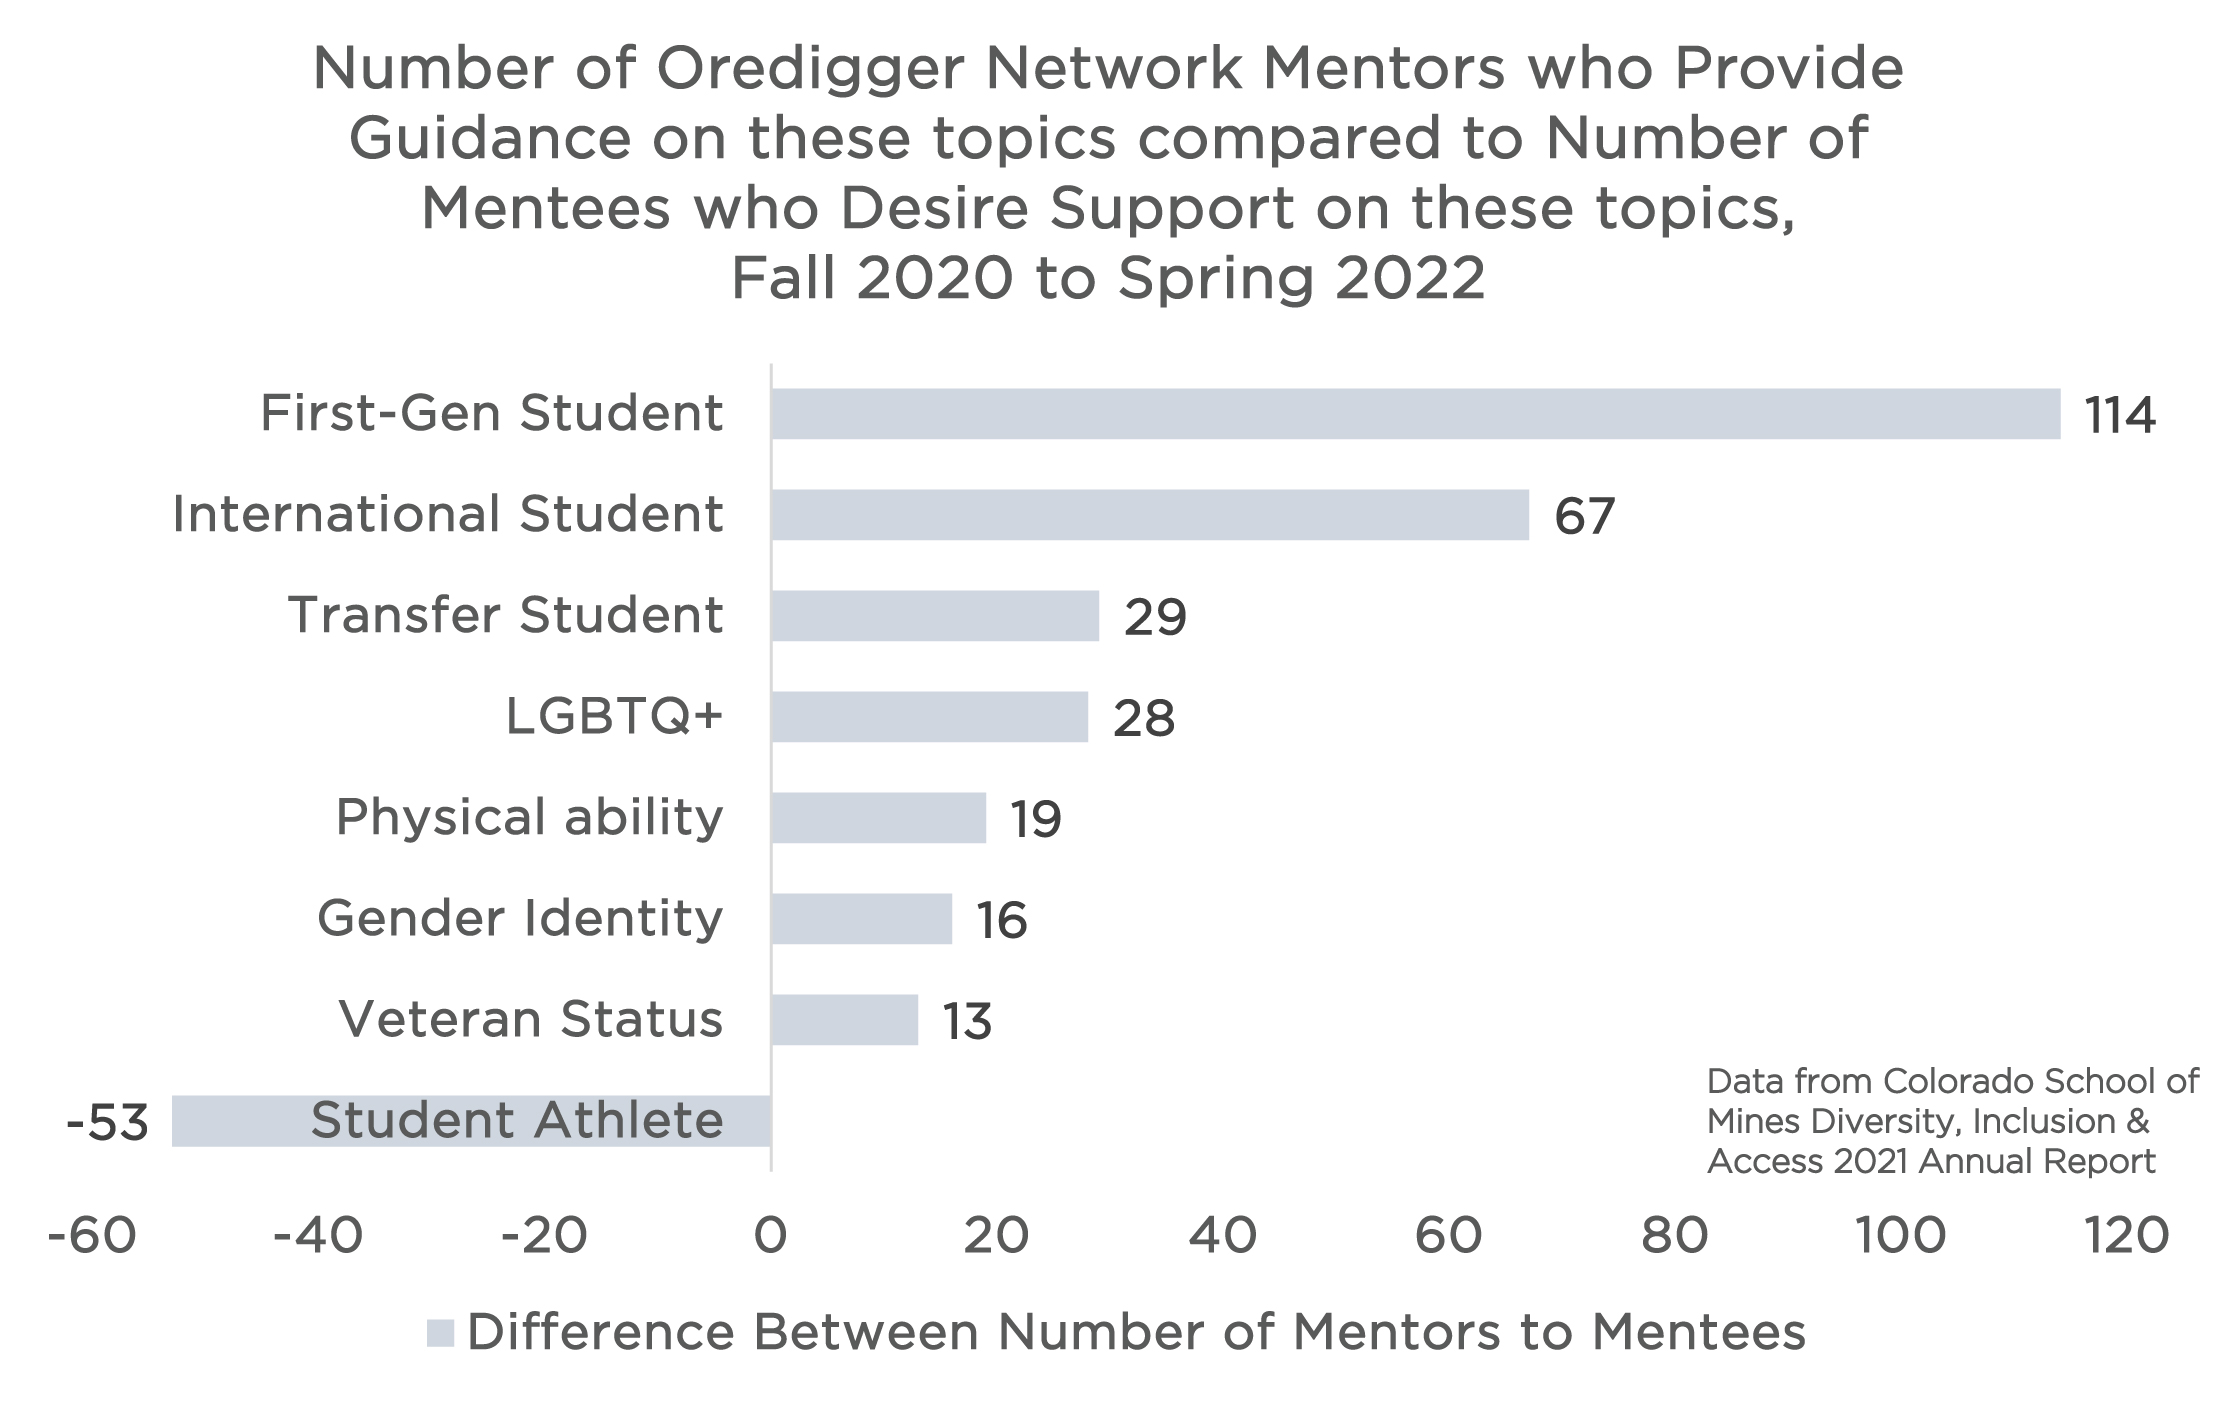
The Oredigger Network is part of the Mines Mentoring Program. When someone signs up to participate in mentoring through the Oredigger Network, they fill out a profile with demographic information, questions about their school and professional background, and what they want to get out of a mentoring connection. For those signed up as a mentee, there is a question that asks, “Would you like assistance or guidance on any of the following?” Mentees can select any, all, or none of the options listed. Mentors get a similar question asking, “Can you provide guidance with regard to any of the following identities?” This graph shows the difference between the number of mentors who can and are willing to provide guidance on these topics compared to the number of students who want guidance on these topics. These data are from the beginning of the program in fall 2020 up to spring 2022. For example, there are 144 extra mentors available to discuss topics related to First-Generation students compared to the number of students who want guidance on that topic. Notice the -53 item for student athletes – this simply shows that it is the only topic that more students are interested in discussing in which mentors do not have experience during their academic careers. In terms of our Strategic Plan Recommendation, “Representation Matters,” this graph provides one example how Mines strives to create role models and support mentors from marginalized identity groups to help foster an inclusive and supportive environment for students or mentees who have these identities. Gender is defined here as only either male or female due to limitations in data collection and reporting. |
Click on graph image to view larger size |
|
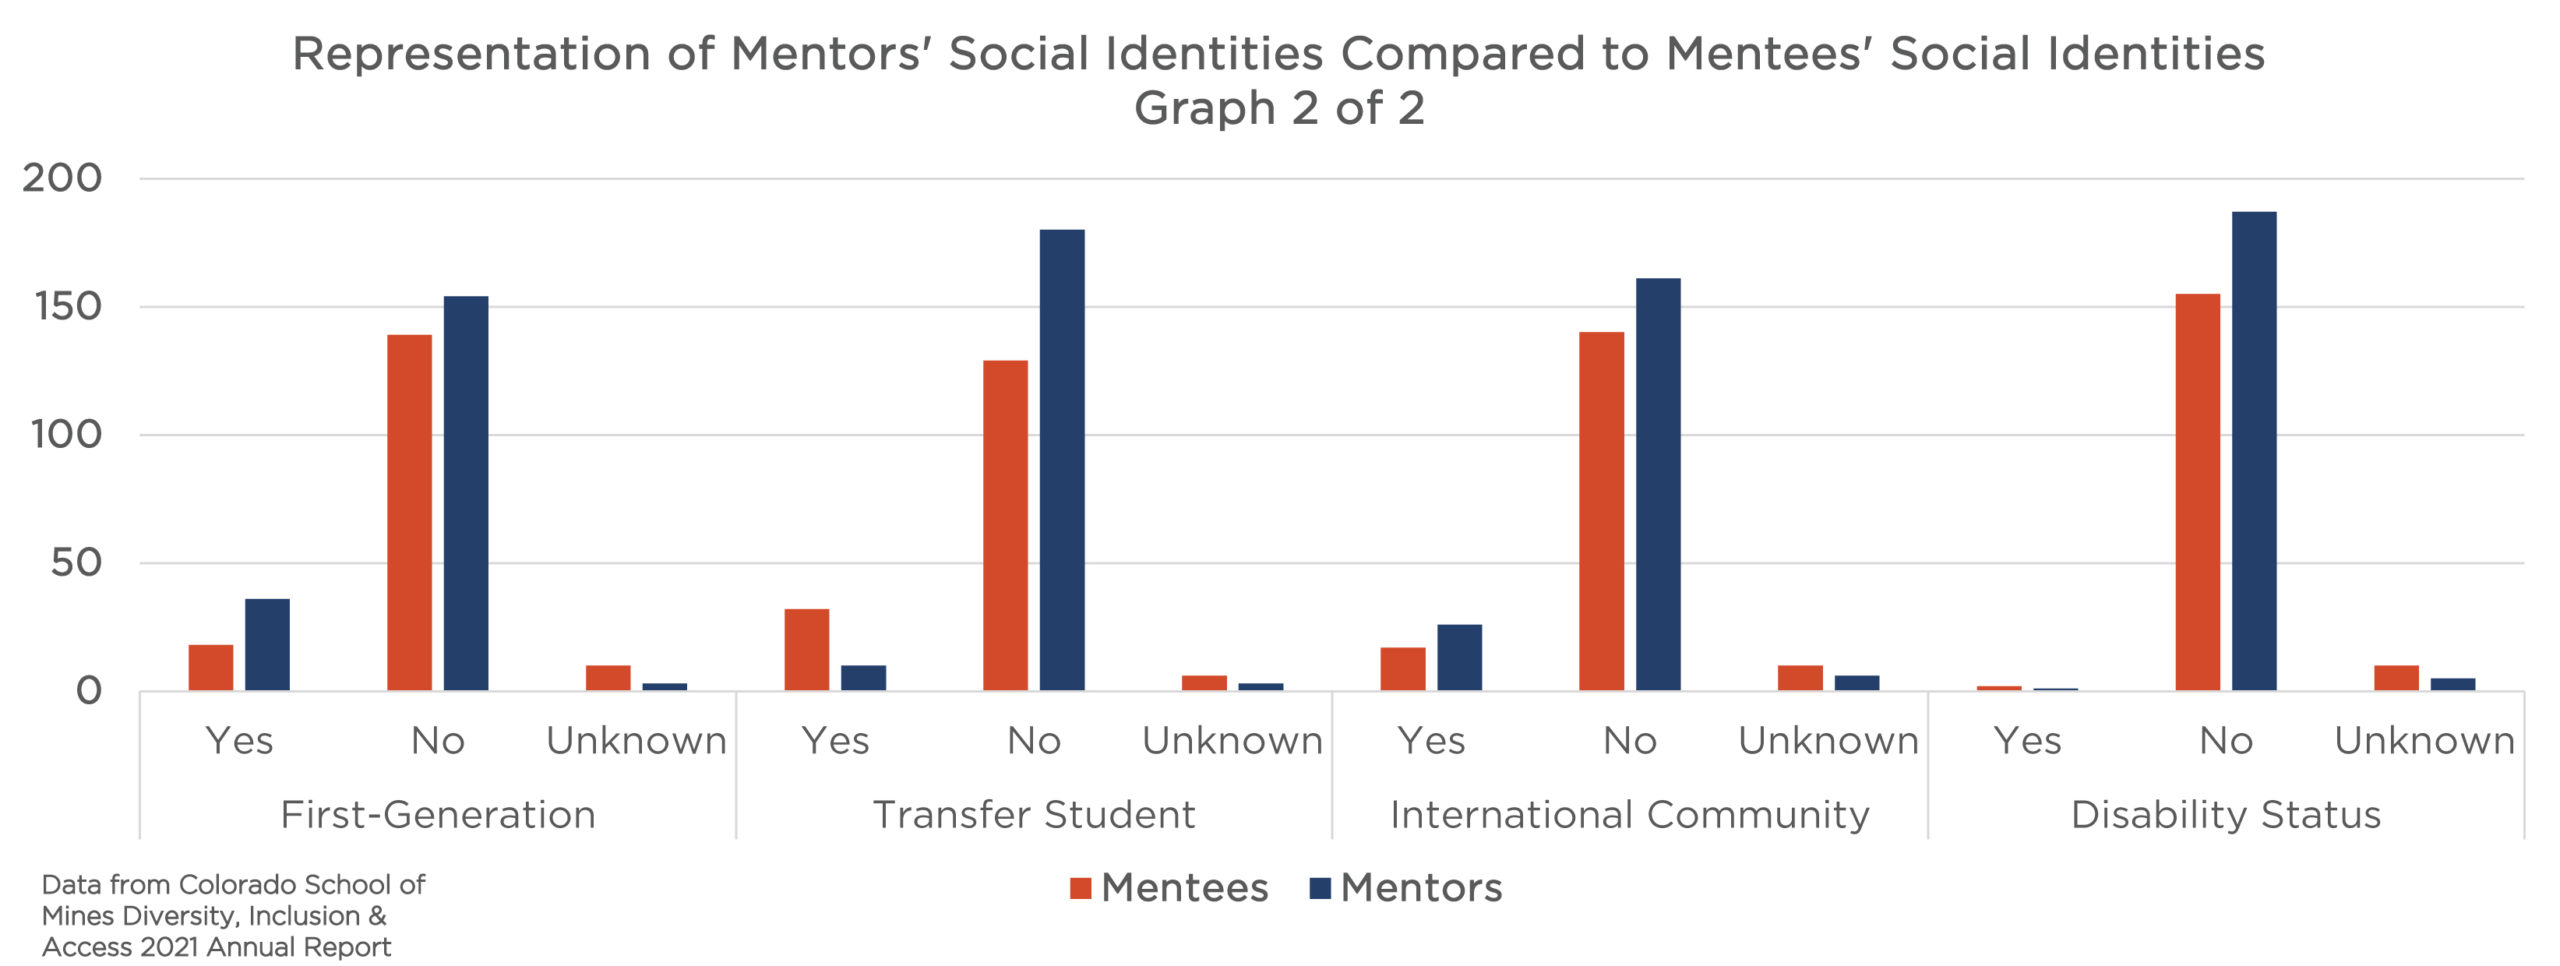
The Oredigger Network is part of the Mines Mentoring Program. When someone signs up to participate in mentoring through the Oredigger Network, they fill out a profile with demographic information, questions about their school and professional background, and what they want to get out of a mentoring connection. This graph shows the number of mentors with self-selected social identities compared to mentees with those same self-selected social identities in 2021. With few exceptions, this graph shows that for most identities, both marginalized and non-marginalized, there are more mentors compared to mentees, demonstrating how representative our mentor pool is to provide support and role modeling for mentees. In the Race/Ethnicity category, there are many “unknown” data points because the Race/Ethnicity demographic question wasn’t included in the initial onboarding experience in 2020. We define URG as those who identify as American Indian/Alaskan Native, African American/Black, Asian, Hispanic/Latinx, multiple races, and Native Hawaiian/Pacific Islander. |
 Click on graph image to view larger size Click on graph image to view larger size |
|
The Oredigger Network is part of the Mines Mentoring Program. When someone signs up to participate in mentoring through the Oredigger Network, they fill out a profile with demographic information, questions about their school and professional background, and what they want to get out of a mentoring connection. Similar to the first graph, this graph demonstrates there are typically more mentors to mentees who share certain social identities. One exception is transfer students. Overall, Mines strives to have proportionate representation of mentors and mentees from all different social identities, and this graph demonstrates areas of strength and opportunities for growth in this space. |
|